
















©2012 Baishideng Publishing Group Co.
World J Gastroenterol. Feb 14, 2012; 18(6): 563-569
Published online Feb 14, 2012. doi: 10.3748/wjg.v18.i6.563
Published online Feb 14, 2012. doi: 10.3748/wjg.v18.i6.563
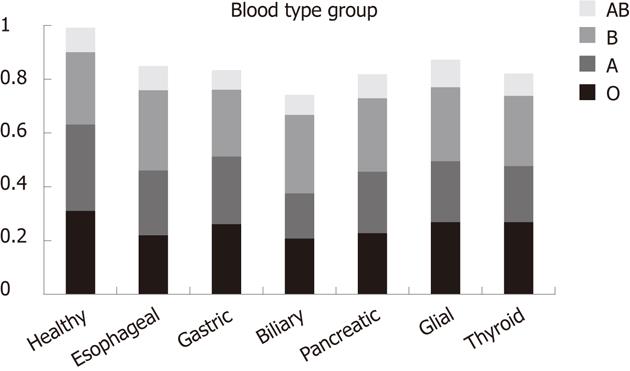
Figure 2 Fraction of each blood type with different population groups.
Different colors represent different blood types (AB, A, B, or O), Blank areas in this figure represent missing values.
- Citation: Gong Y, Yang YS, Zhang XM, Su M, Wang J, Han JD, Guo MZ. ABO blood type, diabetes and risk of gastrointestinal cancer in northern China. World J Gastroenterol 2012; 18(6): 563-569
- URL: https://www.wjgnet.com/1007-9327/full/v18/i6/563.htm
- DOI: https://dx.doi.org/10.3748/wjg.v18.i6.563