
















©2009 The WJG Press and Baishideng.
World J Gastroenterol. Feb 28, 2009; 15(8): 966-972
Published online Feb 28, 2009. doi: 10.3748/wjg.15.966
Published online Feb 28, 2009. doi: 10.3748/wjg.15.966
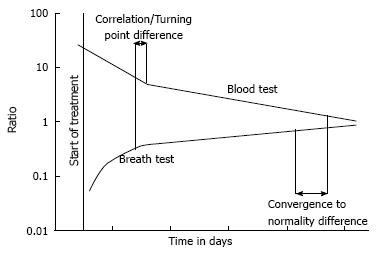
Figure 1 This is an illustration of typical breath test and blood test results plotted over the clinical time course.
The wide green line indicates the range of normal values. As the patient recovered, test results converged toward normality.
- Citation: Lalazar G, Adar T, Ilan Y. Point-of-care continuous 13C-methacetin breath test improves decision making in acute liver disease: Results of a pilot clinical trial. World J Gastroenterol 2009; 15(8): 966-972
- URL: https://www.wjgnet.com/1007-9327/full/v15/i8/966.htm
- DOI: https://dx.doi.org/10.3748/wjg.15.966