
















©2009 The WJG Press and Baishideng.
World J Gastroenterol. Sep 28, 2009; 15(36): 4529-4537
Published online Sep 28, 2009. doi: 10.3748/wjg.15.4529
Published online Sep 28, 2009. doi: 10.3748/wjg.15.4529
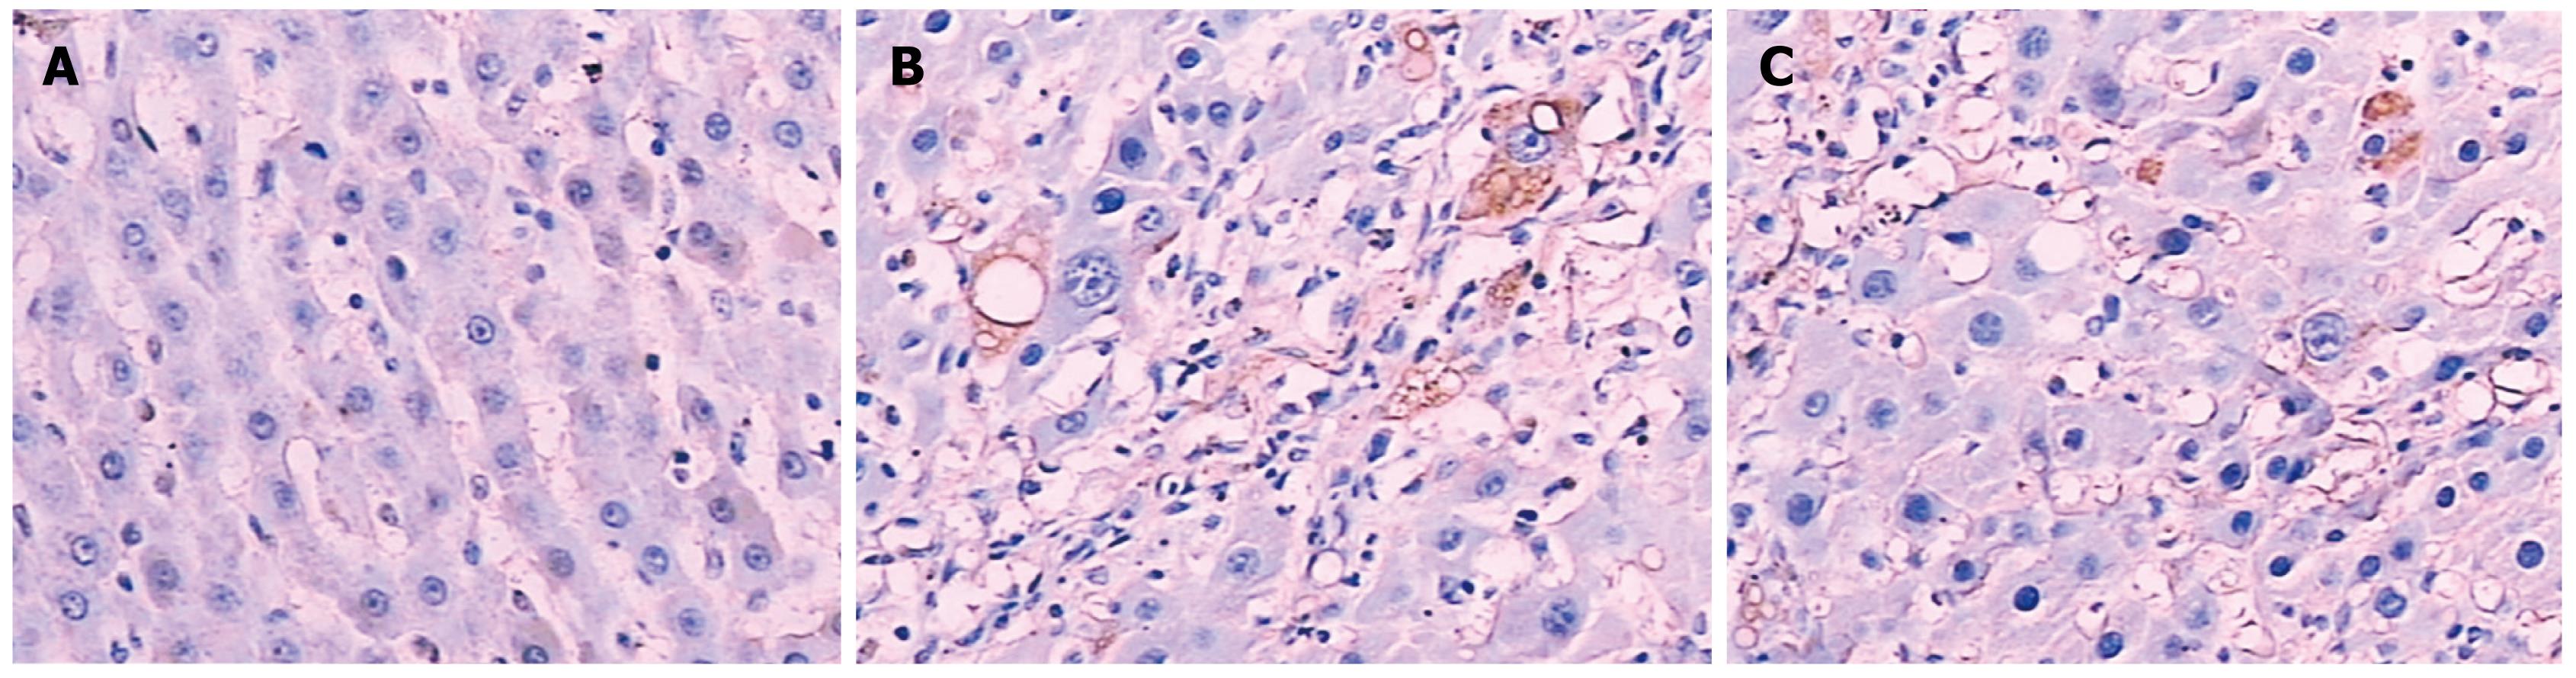
Figure 5 Immunohistochemical analysis of the expression of TGF-β1 in liver tissue of rats in different experimental groups.
A: Normal healthy rats; B: LC rats. Note the increased expression of TGF-β1; C: NTau-treated rats. Note that the expression of TGF-β1 was reduced. (magnification, 10 × 20).
- Citation: Liang J, Deng X, Lin ZX, Zhao LC, Zhang XL. Attenuation of portal hypertension by natural taurine in rats with liver cirrhosis. World J Gastroenterol 2009; 15(36): 4529-4537
- URL: https://www.wjgnet.com/1007-9327/full/v15/i36/4529.htm
- DOI: https://dx.doi.org/10.3748/wjg.15.4529