
















©2009 The WJG Press and Baishideng.
World J Gastroenterol. Jul 28, 2009; 15(28): 3532-3537
Published online Jul 28, 2009. doi: 10.3748/wjg.15.3532
Published online Jul 28, 2009. doi: 10.3748/wjg.15.3532
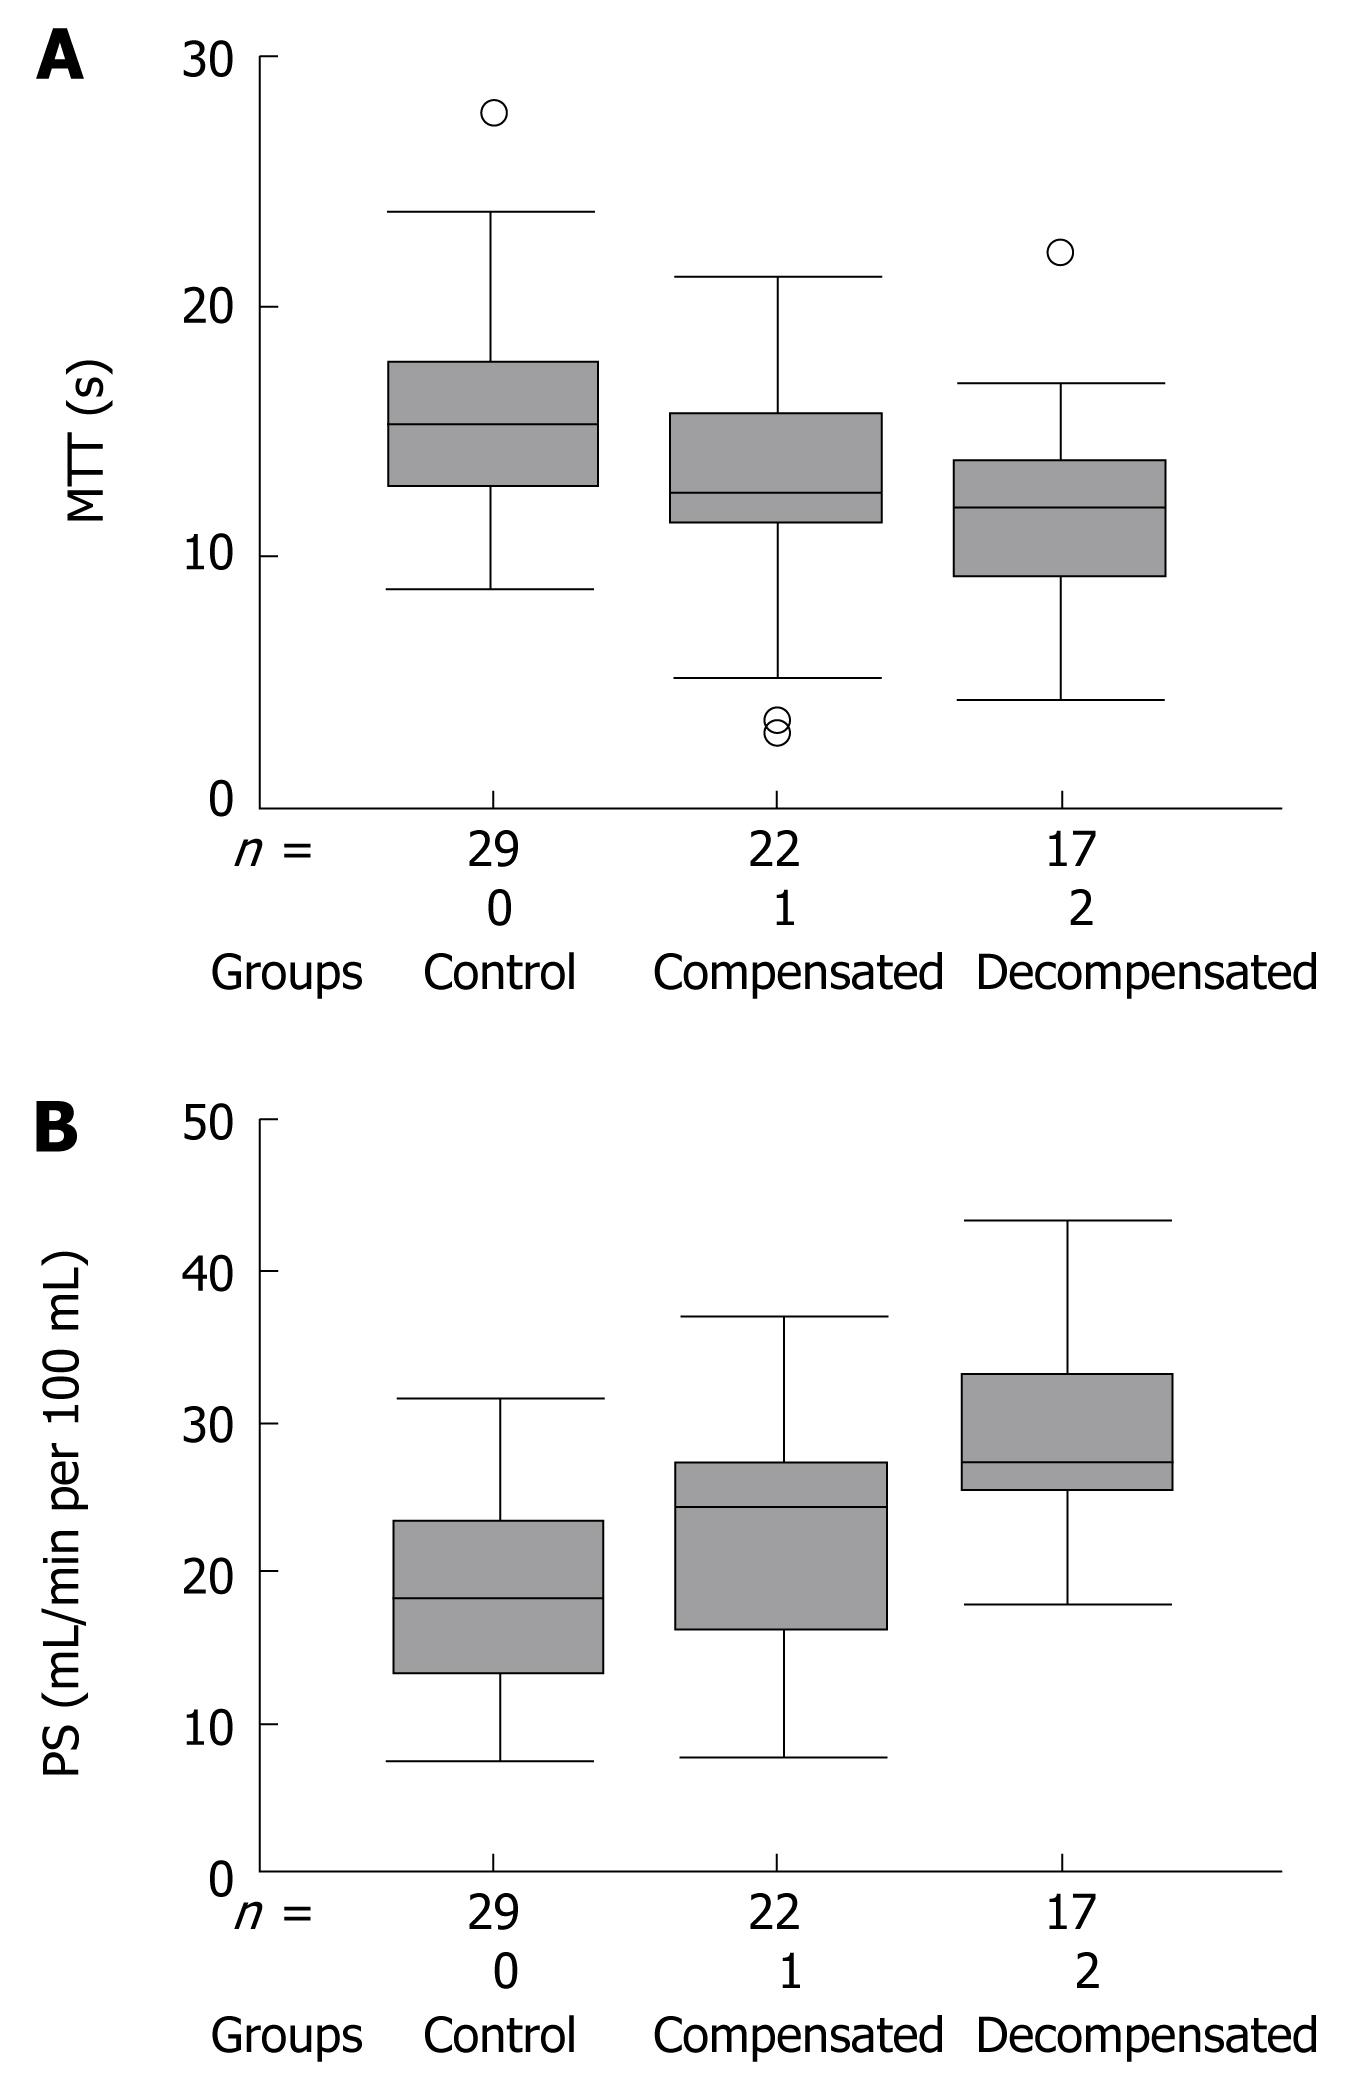
Figure 2 The box-whisker plots show the distribution of hepatic microvacular parameters in controls as well as in compensated and decompensated cirrhosis patients.
The values of MTT (A) and PS (B) are shown.
- Citation: Chen ML, Zeng QY, Huo JW, Yin XM, Li BP, Liu JX. Assessment of the hepatic microvascular changes in liver cirrhosis by perfusion computed tomography. World J Gastroenterol 2009; 15(28): 3532-3537
- URL: https://www.wjgnet.com/1007-9327/full/v15/i28/3532.htm
- DOI: https://dx.doi.org/10.3748/wjg.15.3532