
















©2009 The WJG Press and Baishideng.
World J Gastroenterol. Mar 21, 2009; 15(11): 1319-1330
Published online Mar 21, 2009. doi: 10.3748/wjg.15.1319
Published online Mar 21, 2009. doi: 10.3748/wjg.15.1319
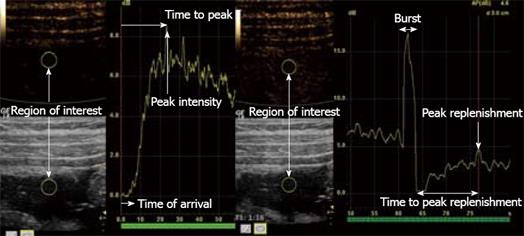
Figure 2 Stenosis of the terminal ileum in a patient with CD.
The right image shows a TIC using bolus tracking. The left image shows burst replenishment without constant infusion in the same patient. When the micro-bubbles are hit by ultrasound with a high MI, this causes them to burst, which produces high-intensity images (Burst). Quantifiable parameters such as time of arrival, peak intensity, time to peak, peak replenishment and time to peak replenishment are shown in the illustration.
- Citation: Nylund K, Ødegaard S, Hausken T, Folvik G, Lied GA, Viola I, Hauser H, Gilja OH. Sonography of the small intestine. World J Gastroenterol 2009; 15(11): 1319-1330
- URL: https://www.wjgnet.com/1007-9327/full/v15/i11/1319.htm
- DOI: https://dx.doi.org/10.3748/wjg.15.1319