
















©2008 The WJG Press and Baishideng.
World J Gastroenterol. Feb 14, 2008; 14(6): 974-979
Published online Feb 14, 2008. doi: 10.3748/wjg.14.974
Published online Feb 14, 2008. doi: 10.3748/wjg.14.974
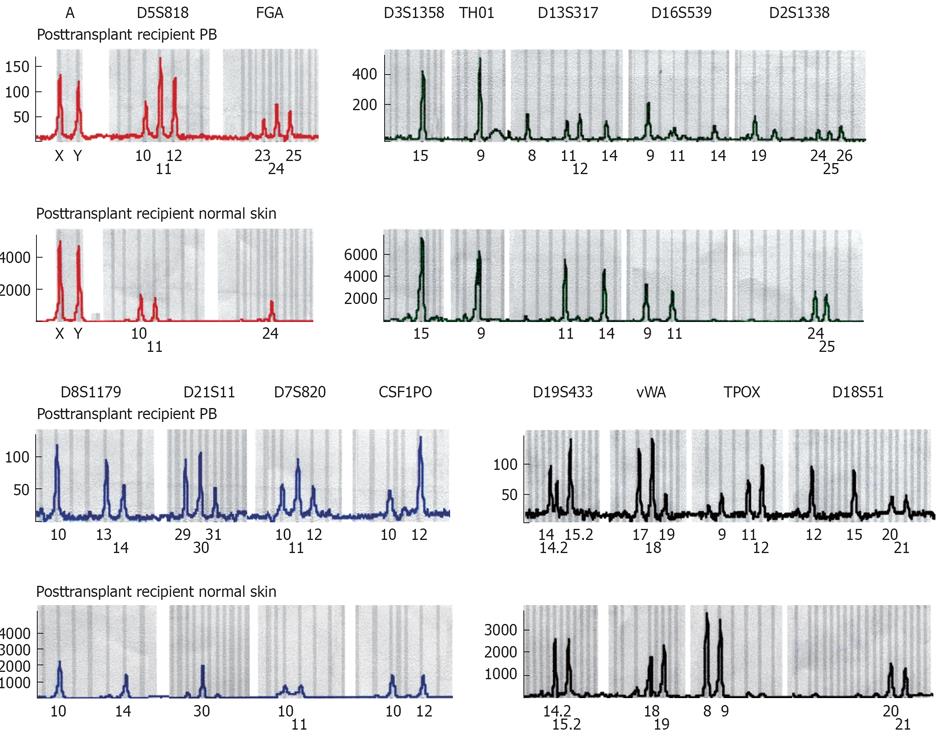
Figure 4 DNA-STR results of peripheral blood and normal skin in the transplanted recipients.
The X axis corresponds to the size of amplified products as noted in base pairs. The Y axis illustrates the amount of fluorescent PCR products. Donor alleles are visible on makers D5S818, FGA D13S317, D16S539, D2S1338, D8S1179, D21S11, D7S820, D19S433, vWA, TPOX, D18S51.
- Citation: Guo ZY, He XS, Wu LW, Zhu XF, Ju WQ, Wang DP, You S, Ma Y, Wang GD, Huang JF. Graft-verse-host disease after liver transplantation: A report of two cases and review of literature. World J Gastroenterol 2008; 14(6): 974-979
- URL: https://www.wjgnet.com/1007-9327/full/v14/i6/974.htm
- DOI: https://dx.doi.org/10.3748/wjg.14.974