
















©2007 Baishideng Publishing Group Co.
World J Gastroenterol. Jan 14, 2007; 13(2): 228-235
Published online Jan 14, 2007. doi: 10.3748/wjg.v13.i2.228
Published online Jan 14, 2007. doi: 10.3748/wjg.v13.i2.228
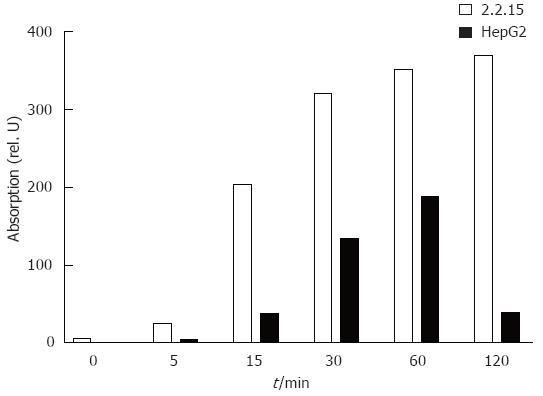
Figure 2 Analysis of Stat1 phosphorylation after IFN-α stimulation in HepG2 and HepG2.
2.15 cells. Cells were stimulated with 100 U/mL of IFN-α for the indicated time points. Then, nuclear proteins were extracted and analysed by western blot. Data were quantified using Imagequant and are shown as relative units.
- Citation: Guan SH, Lu M, Grünewald P, Roggendorf M, Gerken G, Schlaak JF. Interferon-α response in chronic hepatitis B-transfected HepG2.2.15 cells is partially restored by lamivudine treatment. World J Gastroenterol 2007; 13(2): 228-235
- URL: https://www.wjgnet.com/1007-9327/full/v13/i2/228.htm
- DOI: https://dx.doi.org/10.3748/wjg.v13.i2.228