
















©2006 Baishideng Publishing Group Co.
World J Gastroenterol. Feb 14, 2006; 12(6): 961-965
Published online Feb 14, 2006. doi: 10.3748/wjg.v12.i6.961
Published online Feb 14, 2006. doi: 10.3748/wjg.v12.i6.961
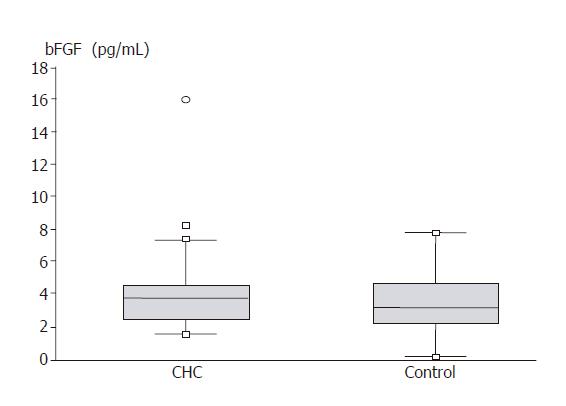
Figure 3 Serum levels of bFGF (pg/mL) in CHC group and control group.
The box represents the interquartile range. The whiskers indicate the highest and lowest values. The line across the box indicates the median value.
- Citation: Janczewska-Kazek E, Marek B, Kajdaniuk D, Borgiel-Marek H. Effect of interferon alpha and ribavirin treatment on serum levels of transforming growth factor-β1, vascular endothelial growth factor, and basic fibroblast growth factor in patients with chronic hepatitis C. World J Gastroenterol 2006; 12(6): 961-965
- URL: https://www.wjgnet.com/1007-9327/full/v12/i6/961.htm
- DOI: https://dx.doi.org/10.3748/wjg.v12.i6.961