
















©2006 Baishideng Publishing Group Co.
World J Gastroenterol. Jun 7, 2006; 12(21): 3344-3351
Published online Jun 7, 2006. doi: 10.3748/wjg.v12.i21.3344
Published online Jun 7, 2006. doi: 10.3748/wjg.v12.i21.3344
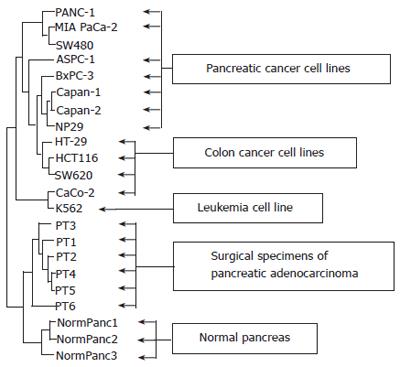
Figure 1 Hierarchical clustering analysis of sample expression profiles.
Dendrogram of centered mean expression data using euclidian distance with average linkage clustering, showing relationships in gene expression profiles of samples. Closely related samples are found in the same branch of the tree and a reduced branch height represents a closer relationship between groups.
- Citation: Laurell H, Bouisson M, Berthelémy P, Rochaix P, Déjean S, Besse P, Susini C, Pradayrol L, Vaysse N, Buscail L. Identification of biomarkers of human pancreatic adenocarcinomas by expression profiling and validation with gene expression analysis in endoscopic ultrasound-guided fine needle aspiration samples. World J Gastroenterol 2006; 12(21): 3344-3351
- URL: https://www.wjgnet.com/1007-9327/full/v12/i21/3344.htm
- DOI: https://dx.doi.org/10.3748/wjg.v12.i21.3344