Copyright
©The Author(s) 2017.
World J Meta-Anal. Dec 26, 2017; 5(6): 167-176
Published online Dec 26, 2017. doi: 10.13105/wjma.v5.i6.167
Published online Dec 26, 2017. doi: 10.13105/wjma.v5.i6.167
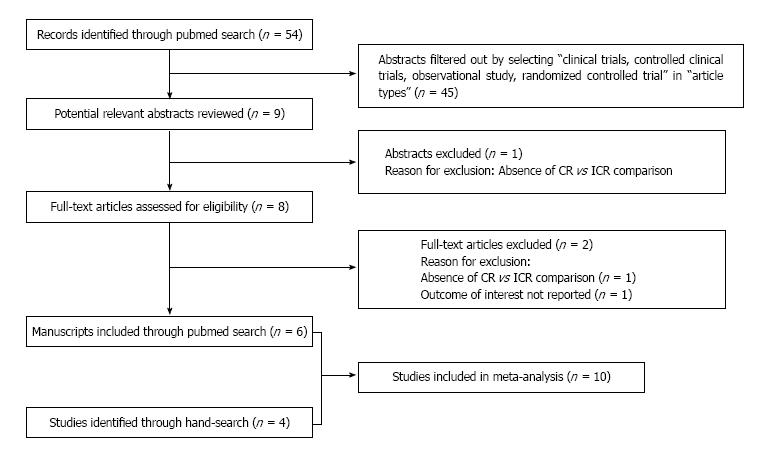
Figure 1 Flow diagram of literature search and study selection.
ICR: Incomplete revascularization.
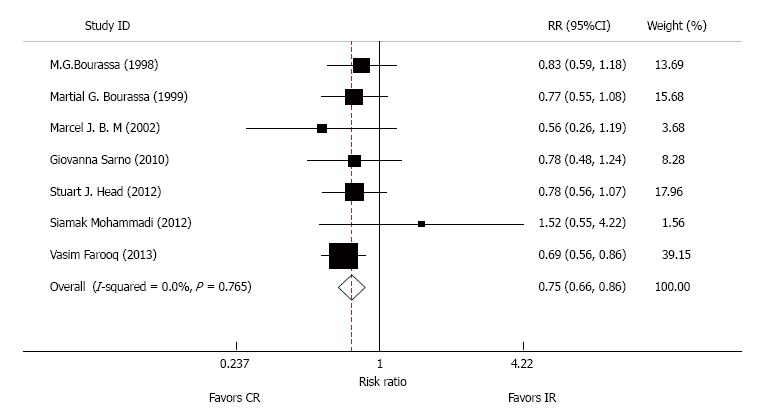
Figure 2 Pooled analysis with risk ratio and 95%CI for the occurrence of total mortality.
Boxes are relative risk estimates from each study. The horizontal bars are 95%CI. The size of the box is proportional to the weight of the study in the pooled analysis. CR: Complete revascularization.
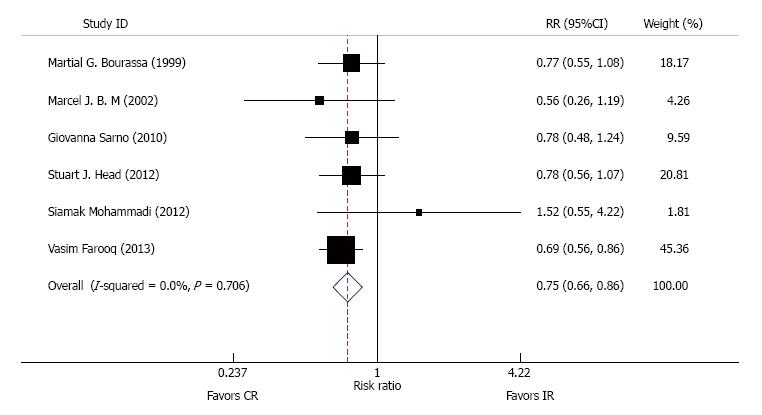
Figure 3 Pooled analysis with risk ratio and 95%CI for the occurrence of mortality in the > 60 age group.
Boxes are relative risk estimates from each study. The horizontal bars are 95%CI. The size of the box is proportional to the weight of the study in the pooled analysis. CR: Complete revascularization.
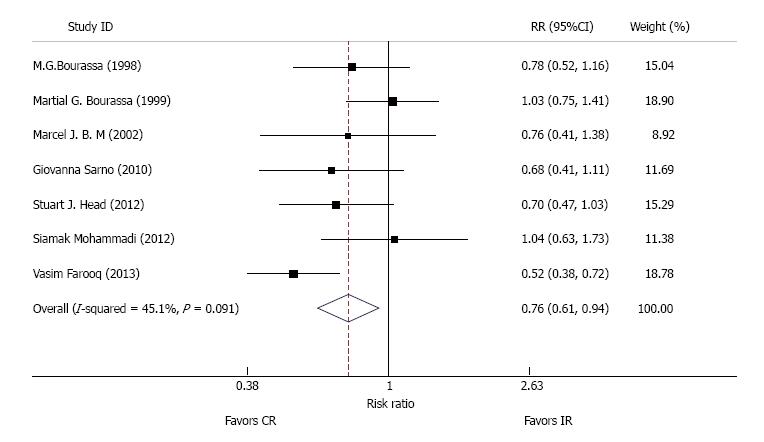
Figure 4 Pooled analysis with risk ratio and 95%CI for occurrence of myocardial infarction.
Boxes are relative risk estimates from each study. The horizontal bars are 95%CI. The size of the box is proportional to the weight of the study in the pooled analysis. CR: Complete revascularization.
- Citation: Auchoybur ML, Chen X. Complete revascularization reduces adverse outcomes in patients with multivessel coronary artery disease. World J Meta-Anal 2017; 5(6): 167-176
- URL: https://www.wjgnet.com/2308-3840/full/v5/i6/167.htm
- DOI: https://dx.doi.org/10.13105/wjma.v5.i6.167


