Copyright
©The Author(s) 2017.
World J Meta-Anal. Oct 26, 2017; 5(5): 124-131
Published online Oct 26, 2017. doi: 10.13105/wjma.v5.i5.124
Published online Oct 26, 2017. doi: 10.13105/wjma.v5.i5.124
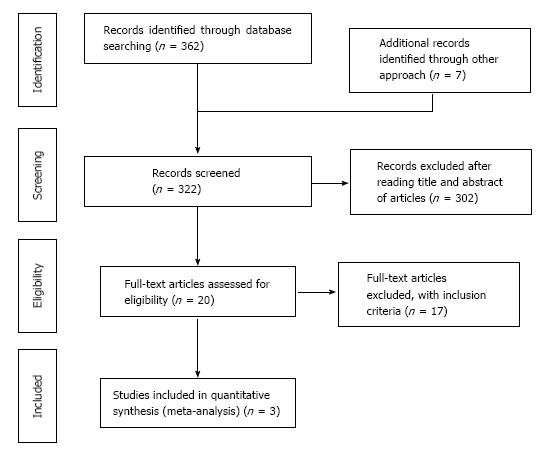
Figure 1 PRISMA selection.
Study selection process according to the PRISMA statement meaningful analysis, funnel plots were not used to investigate publication bias.
Figure 2 Risk of bias graph: Review authors’ judgements about each risk of bias item presented as percentages across all included studies.
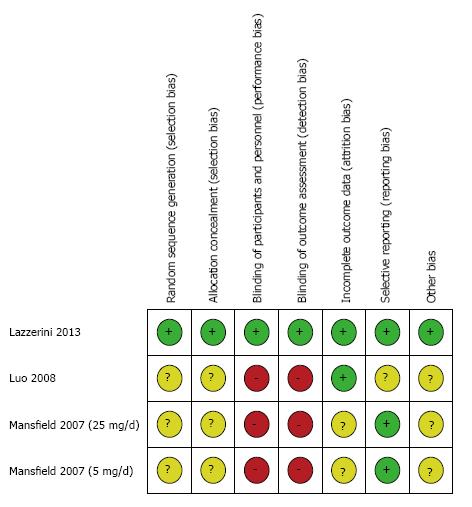
Figure 3 Risk of bias summary: Review authors’ judgments about each risk of bias item for each included study.
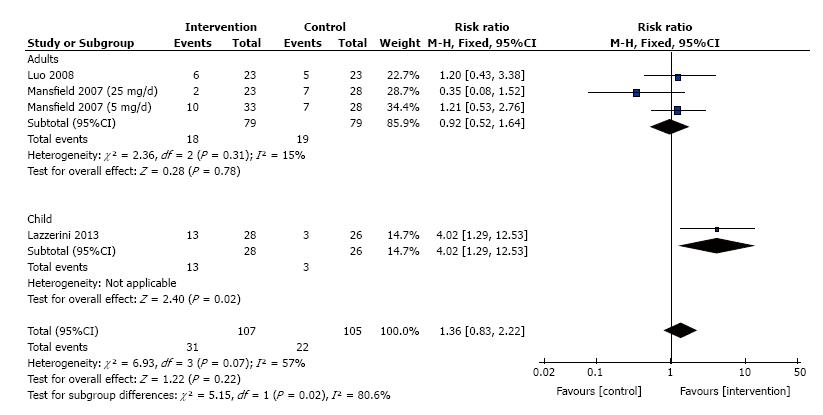
Figure 4 Remission: Fixed effects model forest plot of weighted pooled estimate.
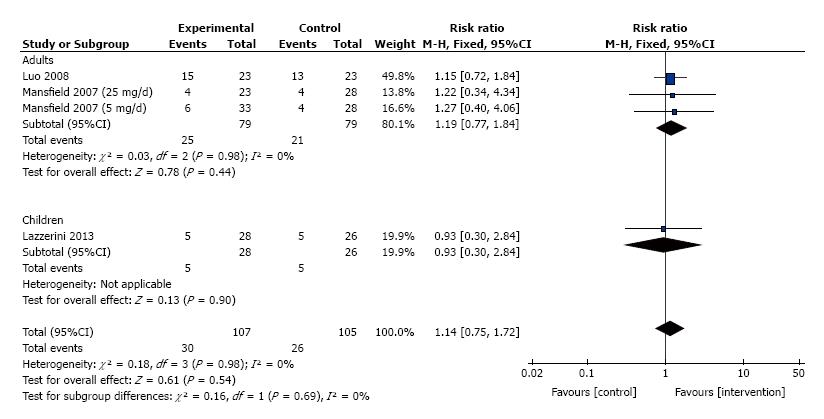
Figure 5 Clinical response: Fixed effects model forest plot of weighted pooled estimate.
Figure 6 Adverse events: Fixed effects model forest plot of weighted pooled estimate.
- Citation: Sami Ullah KR, Xiong YL, Miao YL, Ummair S, Dai W. Thalidomide and thalidomide analogues in treatment of patients with inflammatory bowel disease: Meta-analysis. World J Meta-Anal 2017; 5(5): 124-131
- URL: https://www.wjgnet.com/2308-3840/full/v5/i5/124.htm
- DOI: https://dx.doi.org/10.13105/wjma.v5.i5.124


