Copyright
©The Author(s) 2016.
World J Meta-Anal. Feb 26, 2016; 4(1): 1-9
Published online Feb 26, 2016. doi: 10.13105/wjma.v4.i1.1
Published online Feb 26, 2016. doi: 10.13105/wjma.v4.i1.1
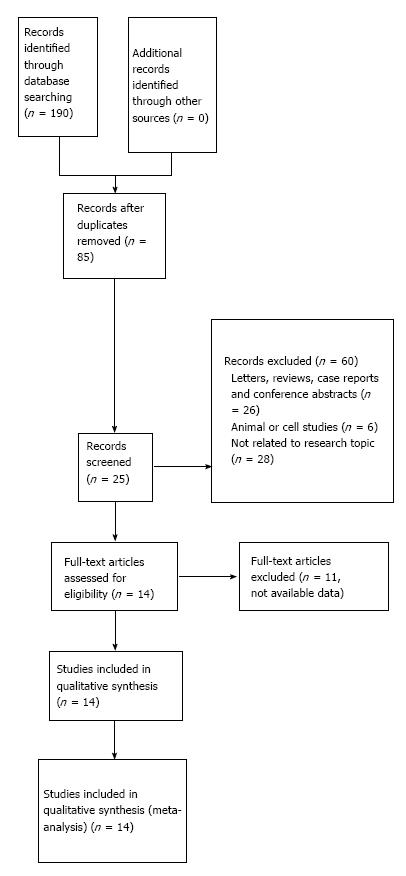
Figure 1 Study selection.
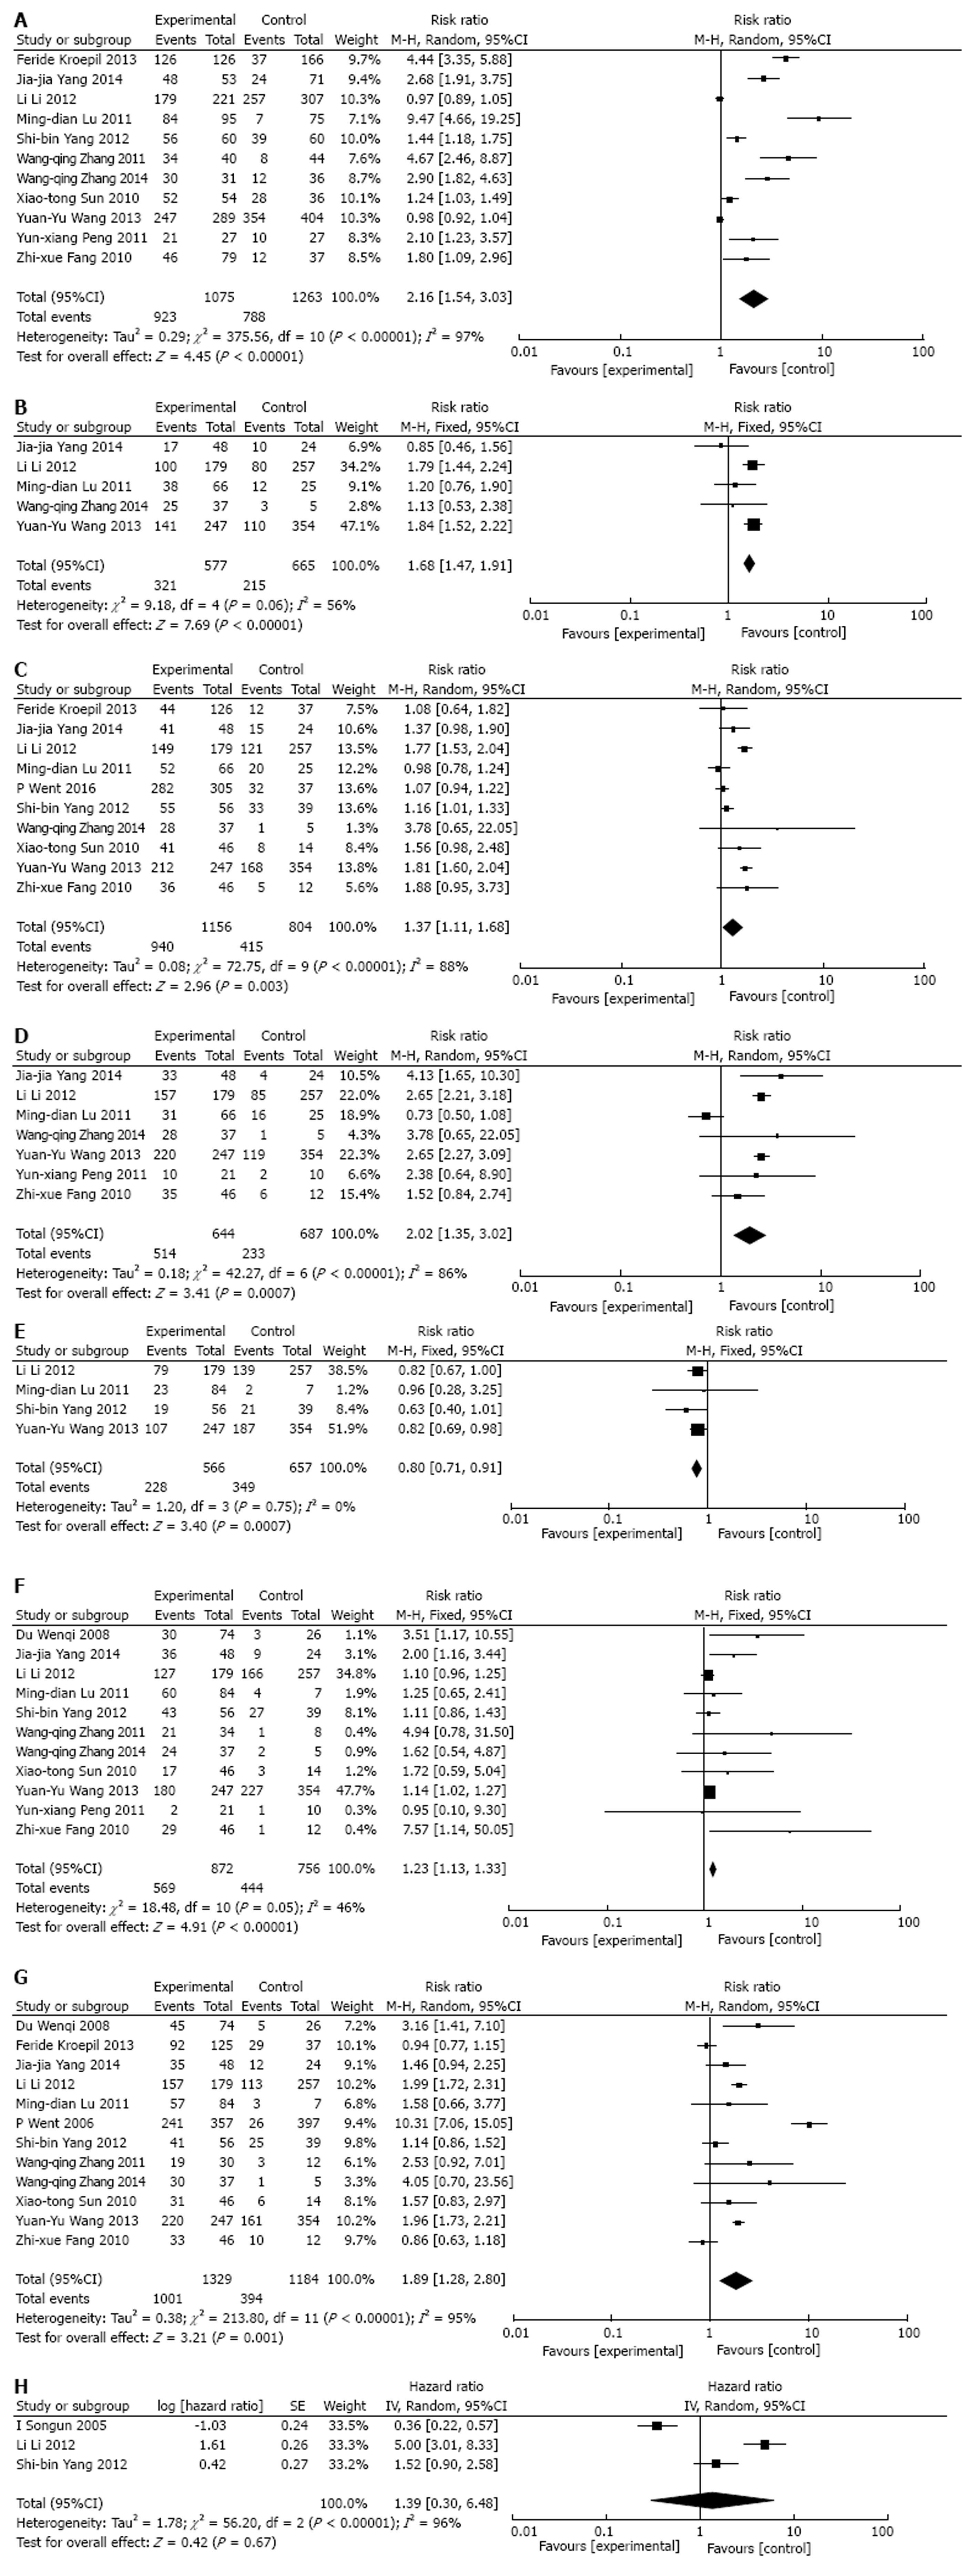
Figure 2 Meta-analysis Forest plot.
A: Meta-analysis Forest plot concerning the expression level of epithelial cellular adhesion molecule with gastric cancer between samples of gastric cancer and normal ones; B: Meta-analysis Forest plot concerning tumor size; C: Meta-analysis Forest plot concerning depth of invasion; D: Meta-analysis Forest plot concerning TNM stage; E: Meta-analysis Forest plot concerning tumor location; F: Meta-analysis Forest plot concerning histologic differentiation; G: Meta-analysis Forest plot concerning lymph node metastasis; H: Meta-analysis Forest plot concerning overall survival rate.
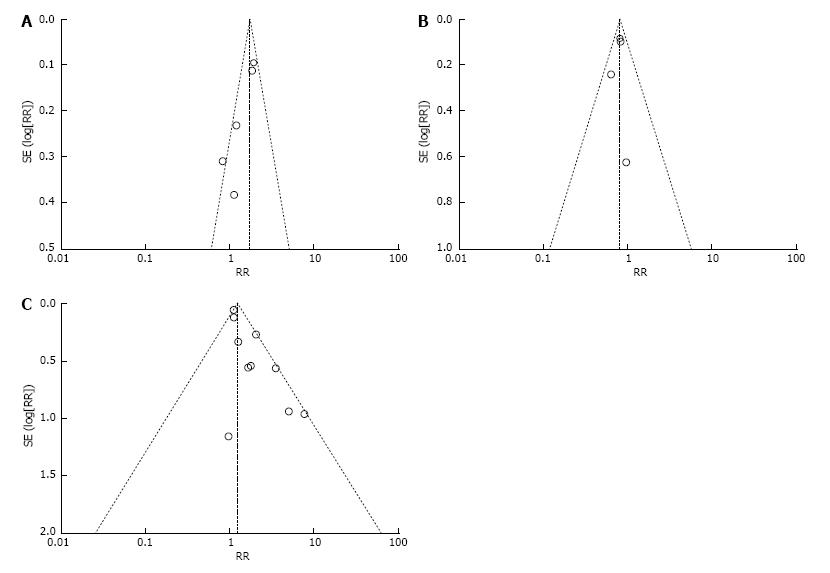
Figure 3 Funnel plot of tumor size (A), tumor location (B) and histologic differentiation (C).
RR: Risk ratio.
- Citation: Xiao YB, Xi HQ, Li JY, Chen L. Expression of epithelial cellular adhesion molecule in gastric cancer: A meta-analysis. World J Meta-Anal 2016; 4(1): 1-9
- URL: https://www.wjgnet.com/2308-3840/full/v4/i1/1.htm
- DOI: https://dx.doi.org/10.13105/wjma.v4.i1.1


