Copyright
©The Author(s) 2015.
World J Meta-Anal. Apr 26, 2015; 3(2): 118-124
Published online Apr 26, 2015. doi: 10.13105/wjma.v3.i2.118
Published online Apr 26, 2015. doi: 10.13105/wjma.v3.i2.118
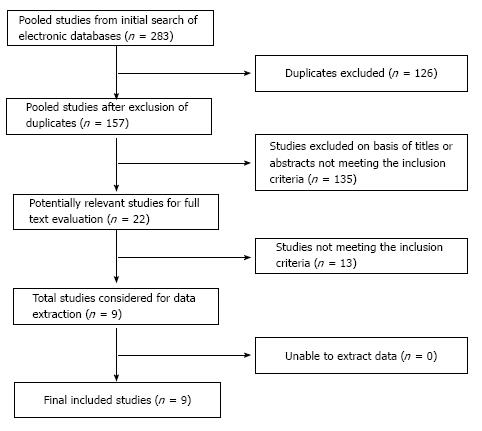
Figure 1 Flow diagram of the number of studies identified, the number excluded and the reasons for exclusions, and the final number of studies included in the systematic review and meta-analysis.
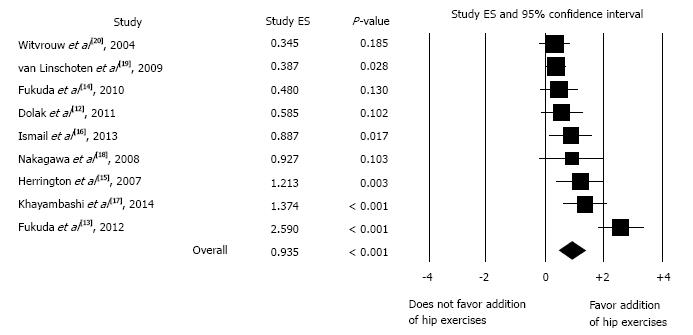
Figure 2 Forest plot of effect sizes from studies that assessed the effect of hip strengthening exercises on pain and function in patients with patellofemoral pain syndrome.
A square represents the effect size for a given study with the size of the square being proportional to the weighting of that study in the meta-analysis. A horizontal line indicates the 95%CI for an effect. Studies are arranged from lowest to highest effect size. The diamond at the bottom represents the overall effect size calculated using a random-effects model. The width of the diamond represents the 95%CI for the overall effect size.
- Citation: Morelli KM, Carrelli M, Nunez MA, Smith CA, Warren GL. Addition of hip exercises to treatment of patellofemoral pain syndrome: A meta-analysis. World J Meta-Anal 2015; 3(2): 118-124
- URL: https://www.wjgnet.com/2308-3840/full/v3/i2/118.htm
- DOI: https://dx.doi.org/10.13105/wjma.v3.i2.118


