Copyright
©2014 Baishideng Publishing Group Inc.
World J Meta-Anal. Nov 26, 2014; 2(4): 212-220
Published online Nov 26, 2014. doi: 10.13105/wjma.v2.i4.212
Published online Nov 26, 2014. doi: 10.13105/wjma.v2.i4.212
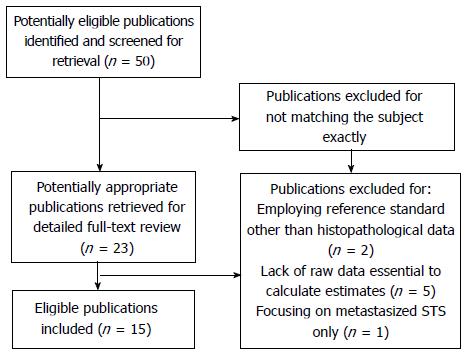
Figure 1 Flow diagram of publication selection for this meta-analysis.
STS: Soft-tissue sarcoma.
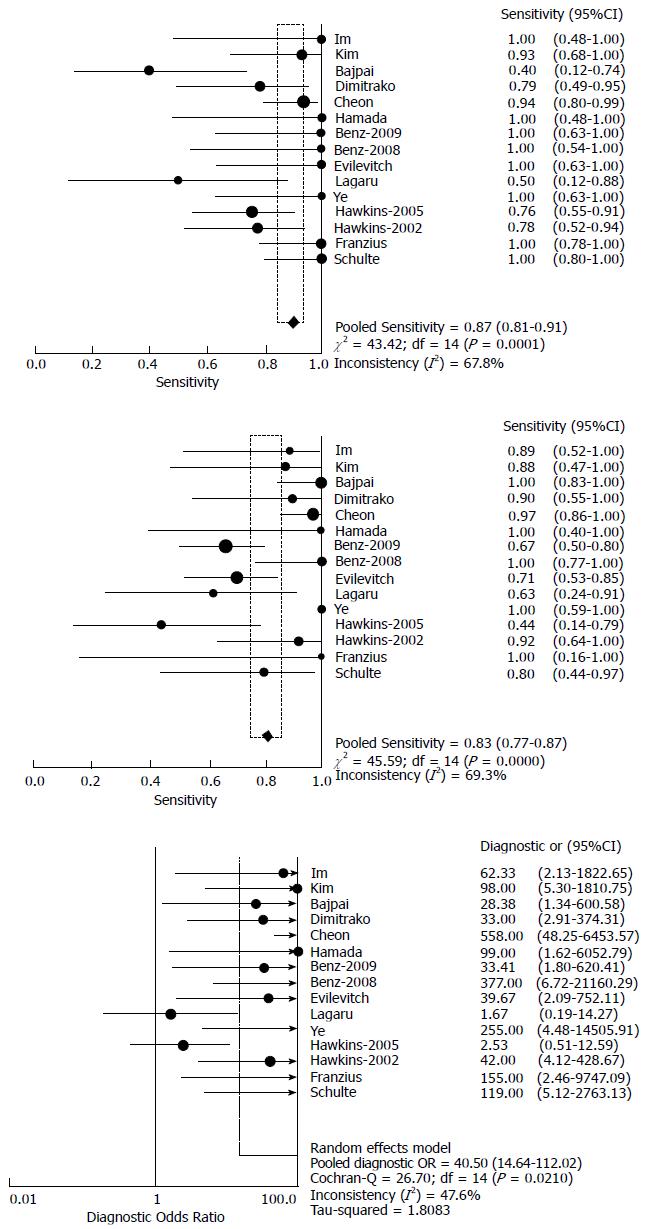
Figure 2 Pooled sensitivity, specificity, and diagnostic odds ratio in forest plots for neoadjuvant therapy response prediction in bone and soft tissue sarcomas by F-18-fluorodeoxy-D-glucose-positron emission tomography.
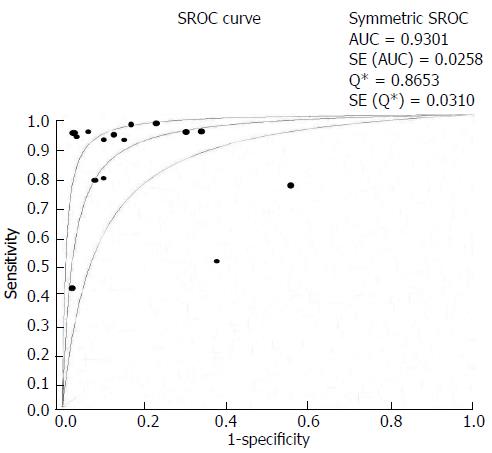
Figure 3 Summary receiver operating characteristic curves for neoadjuvant therapy response prediction in bone and soft tissue sarcomas by F-18-fluorodeoxy-D-glucose-positron emission tomography.
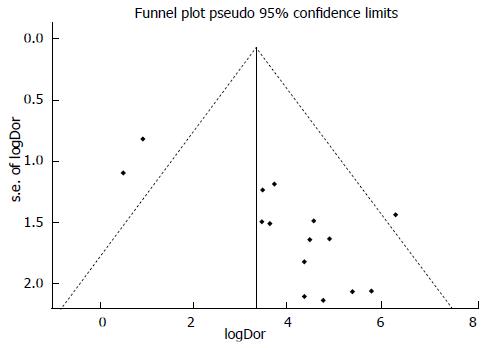
Figure 4 Funnel plot to test publication bias shows some asymmetry.
- Citation: Wang YT, Pu H, Yin LL, Chen JY. Using fluorodeoxy-D-glucose-positron emission tomography to monitor neoadjuvant chemotherapy response in sarcoma: A meta-analysis. World J Meta-Anal 2014; 2(4): 212-220
- URL: https://www.wjgnet.com/2308-3840/full/v2/i4/212.htm
- DOI: https://dx.doi.org/10.13105/wjma.v2.i4.212


