Copyright
©2013 Baishideng Publishing Group Co.
World J Meta-Anal. Nov 26, 2013; 1(3): 102-120
Published online Nov 26, 2013. doi: 10.13105/wjma.v1.i3.102
Published online Nov 26, 2013. doi: 10.13105/wjma.v1.i3.102
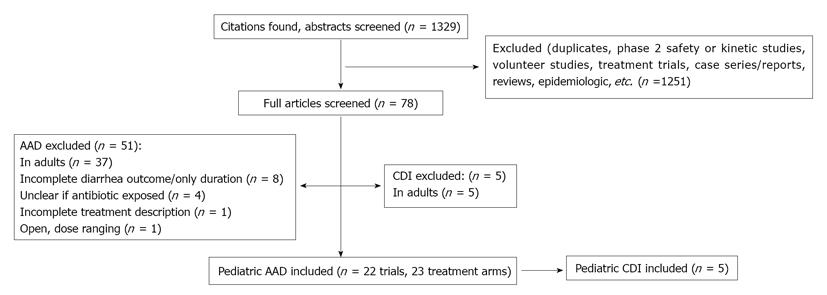
Figure 1 Flow chart of included and excluded trials for pediatric antibiotic-associated diarrhea and Clostridium difficile infections.
AAD: Antibiotic-associated diarrhea; CDI: Clostridium difficile infections.
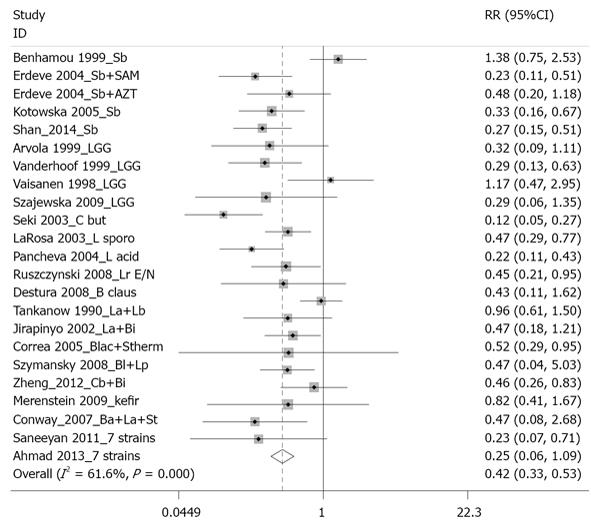
Figure 2 Forest plot of 23 probiotic treatment arms for the prevention of pediatric antibiotic associated diarrhea.
Figure 3 Forest plot of 5 probiotic treatment arms for the prevention of pediatric Clostridium difficile disease.
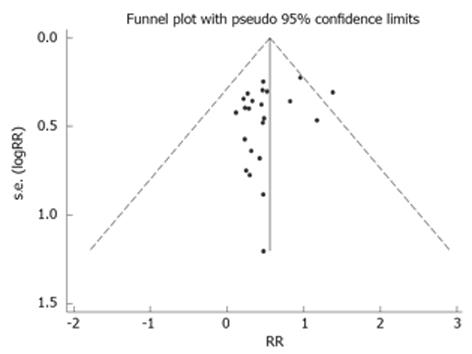
Figure 4 Funnel plot for publication bias assessment from 22 clinical trials for the prevention of pediatric antibiotic associated diarrhea.
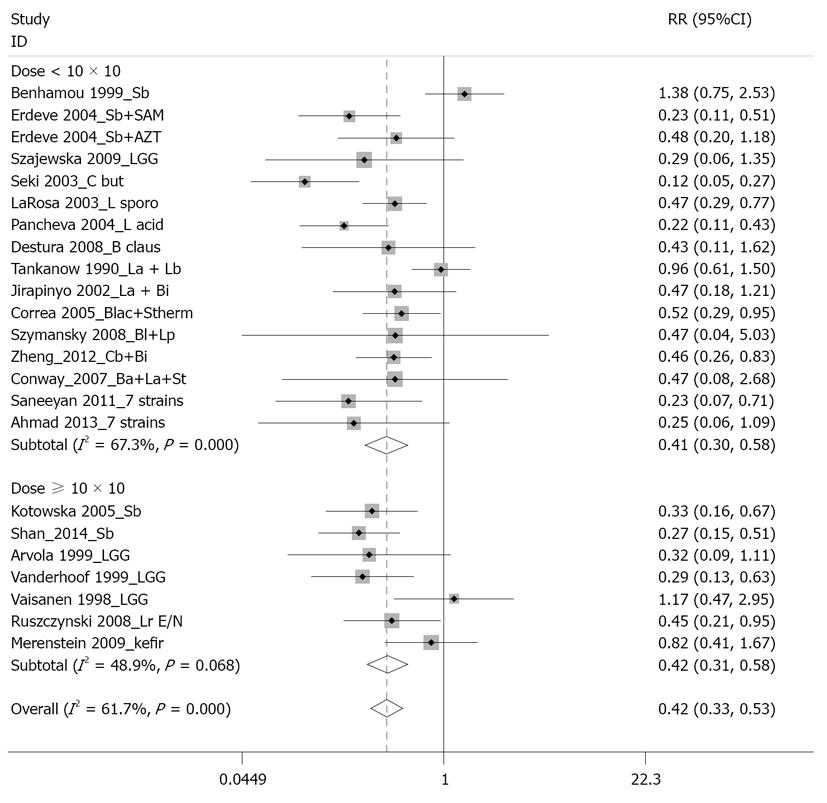
Figure 5 Meta-analysis of pediatric antibiotic-associated diarrhea by high dose (1010 cfu/d) compared to lower doses of daily probiotics given (colony forming units).
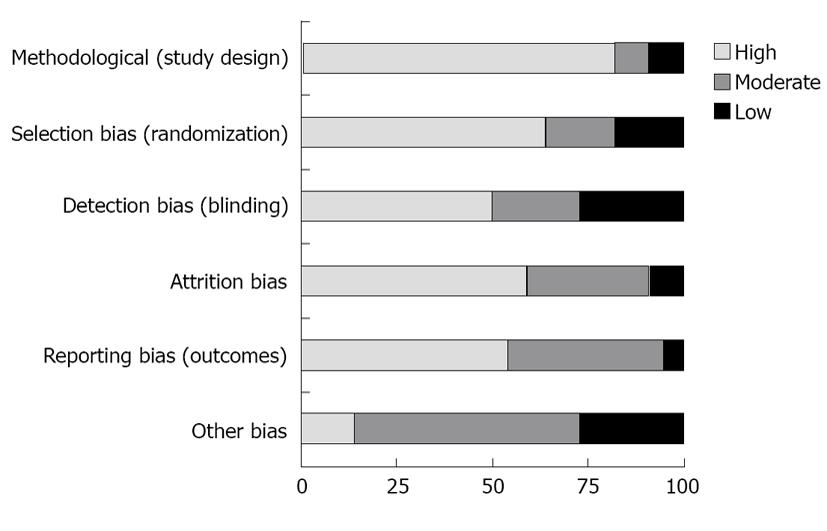
Figure 6 Frequency of study quality based on six different types of potential bias.
Low quality: 0%-50% quality items within category not present; Moderate quality: 51%-75% items not present; High quality: 76%-100% items present.
-
Citation: McFarland LV, Goh S. Preventing pediatric antibiotic-associated diarrhea and
Clostridium difficile infections with probiotics: A meta-analysis. World J Meta-Anal 2013; 1(3): 102-120 - URL: https://www.wjgnet.com/2308-3840/full/v1/i3/102.htm
- DOI: https://dx.doi.org/10.13105/wjma.v1.i3.102


