Copyright
©2013 Baishideng.
World J Meta-Anal. Aug 26, 2013; 1(2): 57-77
Published online Aug 26, 2013. doi: 10.13105/wjma.v1.i2.57
Published online Aug 26, 2013. doi: 10.13105/wjma.v1.i2.57
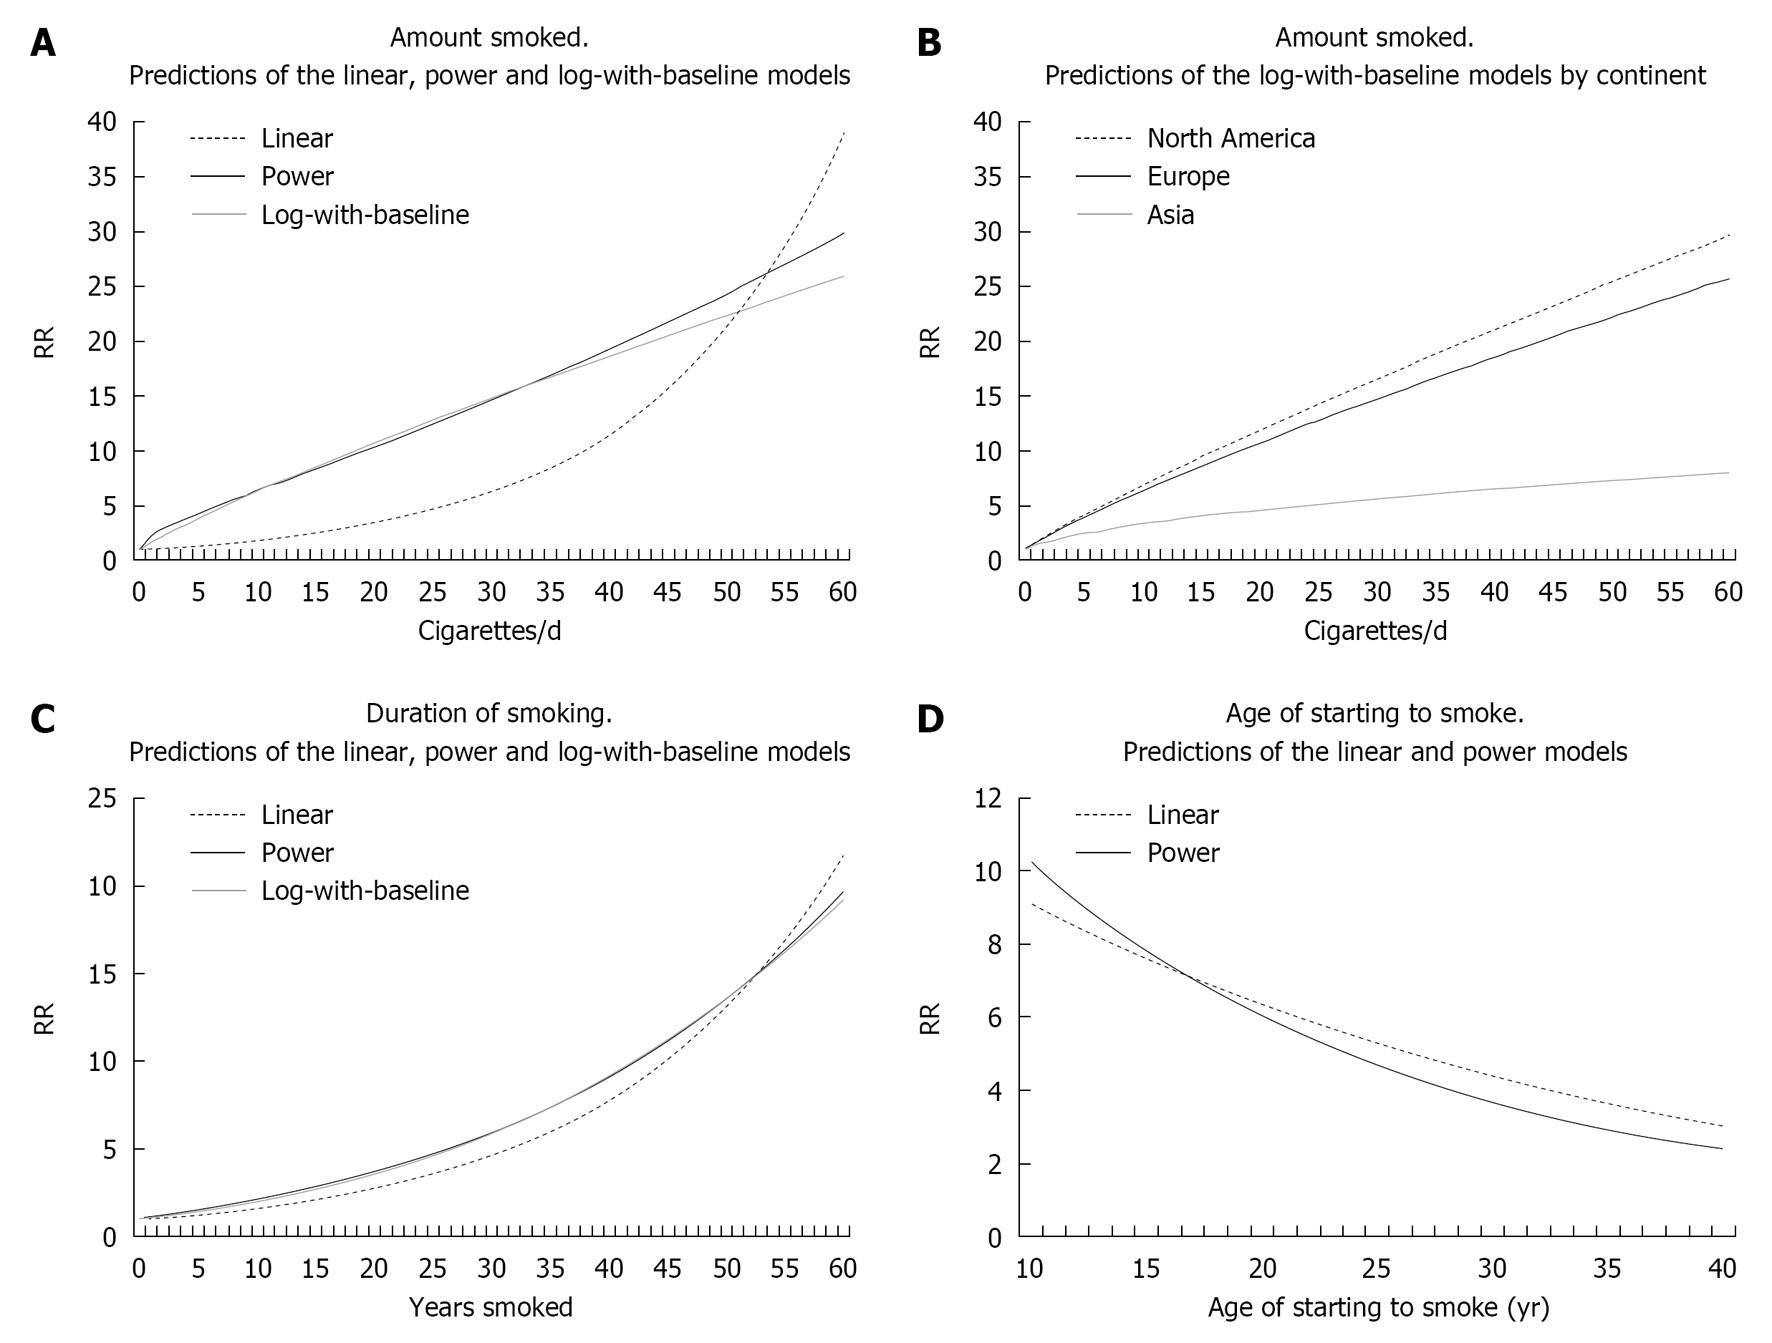
Figure 1 Model predictions.
A: Amount smoked. Predictions of the linear, power and log-with-baseline models; B: Amount smoked. Predictions of the log-with-baseline models by continent; C: Duration of smoking. Predictions of the linear, power, and log-with-baseline models; D: Age of starting to smoke. Predictions of the linear and power models. The RR is plotted against number of cigarettes per day (A and B), years smoked (C) and age of starting to smoke (D). The linear model for amount smoked is the poorest fit to the data, other models shown fitting the data similarly well.
- Citation: Fry JS, Lee PN, Forey BA, Coombs KJ. Dose-response relationship of lung cancer to amount smoked, duration and age starting. World J Meta-Anal 2013; 1(2): 57-77
- URL: https://www.wjgnet.com/2308-3840/full/v1/i2/57.htm
- DOI: https://dx.doi.org/10.13105/wjma.v1.i2.57


