Copyright
©The Author(s) 2015.
World J Obstet Gynecol. Nov 10, 2015; 4(4): 113-123
Published online Nov 10, 2015. doi: 10.5317/wjog.v4.i4.113
Published online Nov 10, 2015. doi: 10.5317/wjog.v4.i4.113
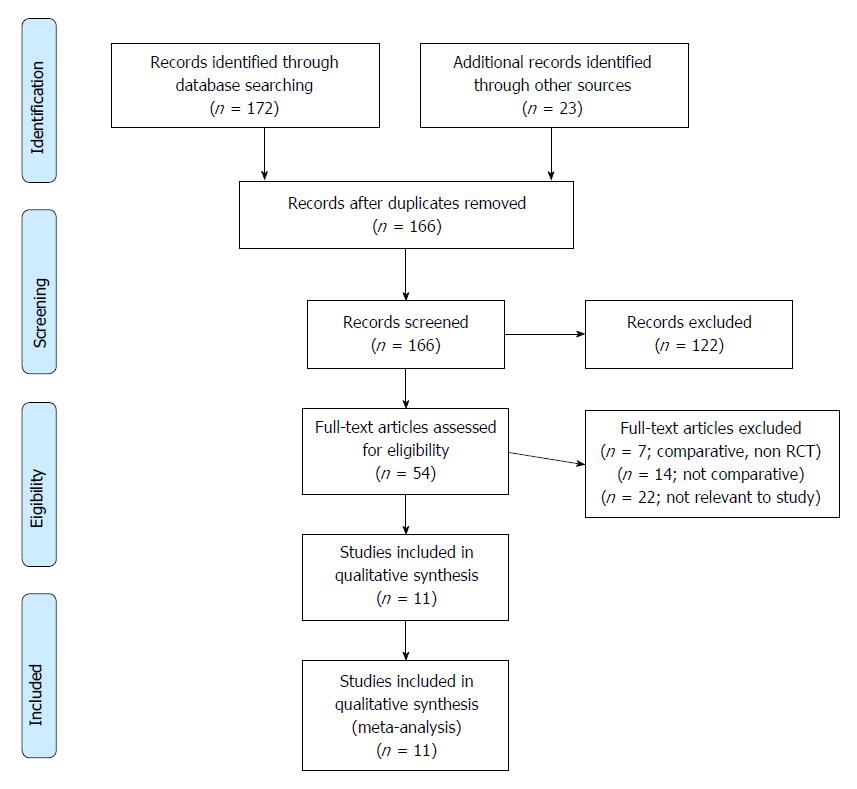
Figure 1 PRISMA flow chart showing trial selection methodology.
RCT: Randomised controlled trial.
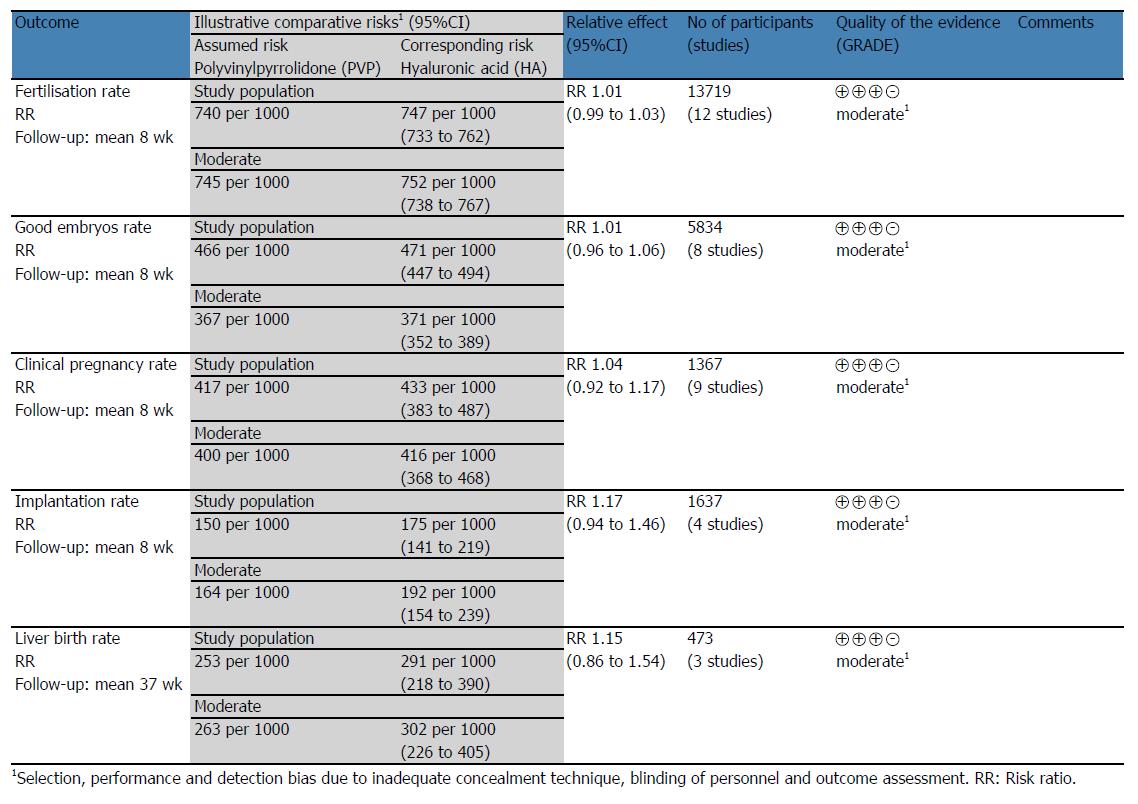
Figure 2 Summary and strength of the evidence from trials analysed on GradePro®.
Figure 3 Risk of bias generated using cochrane risk of bias assessment tool.
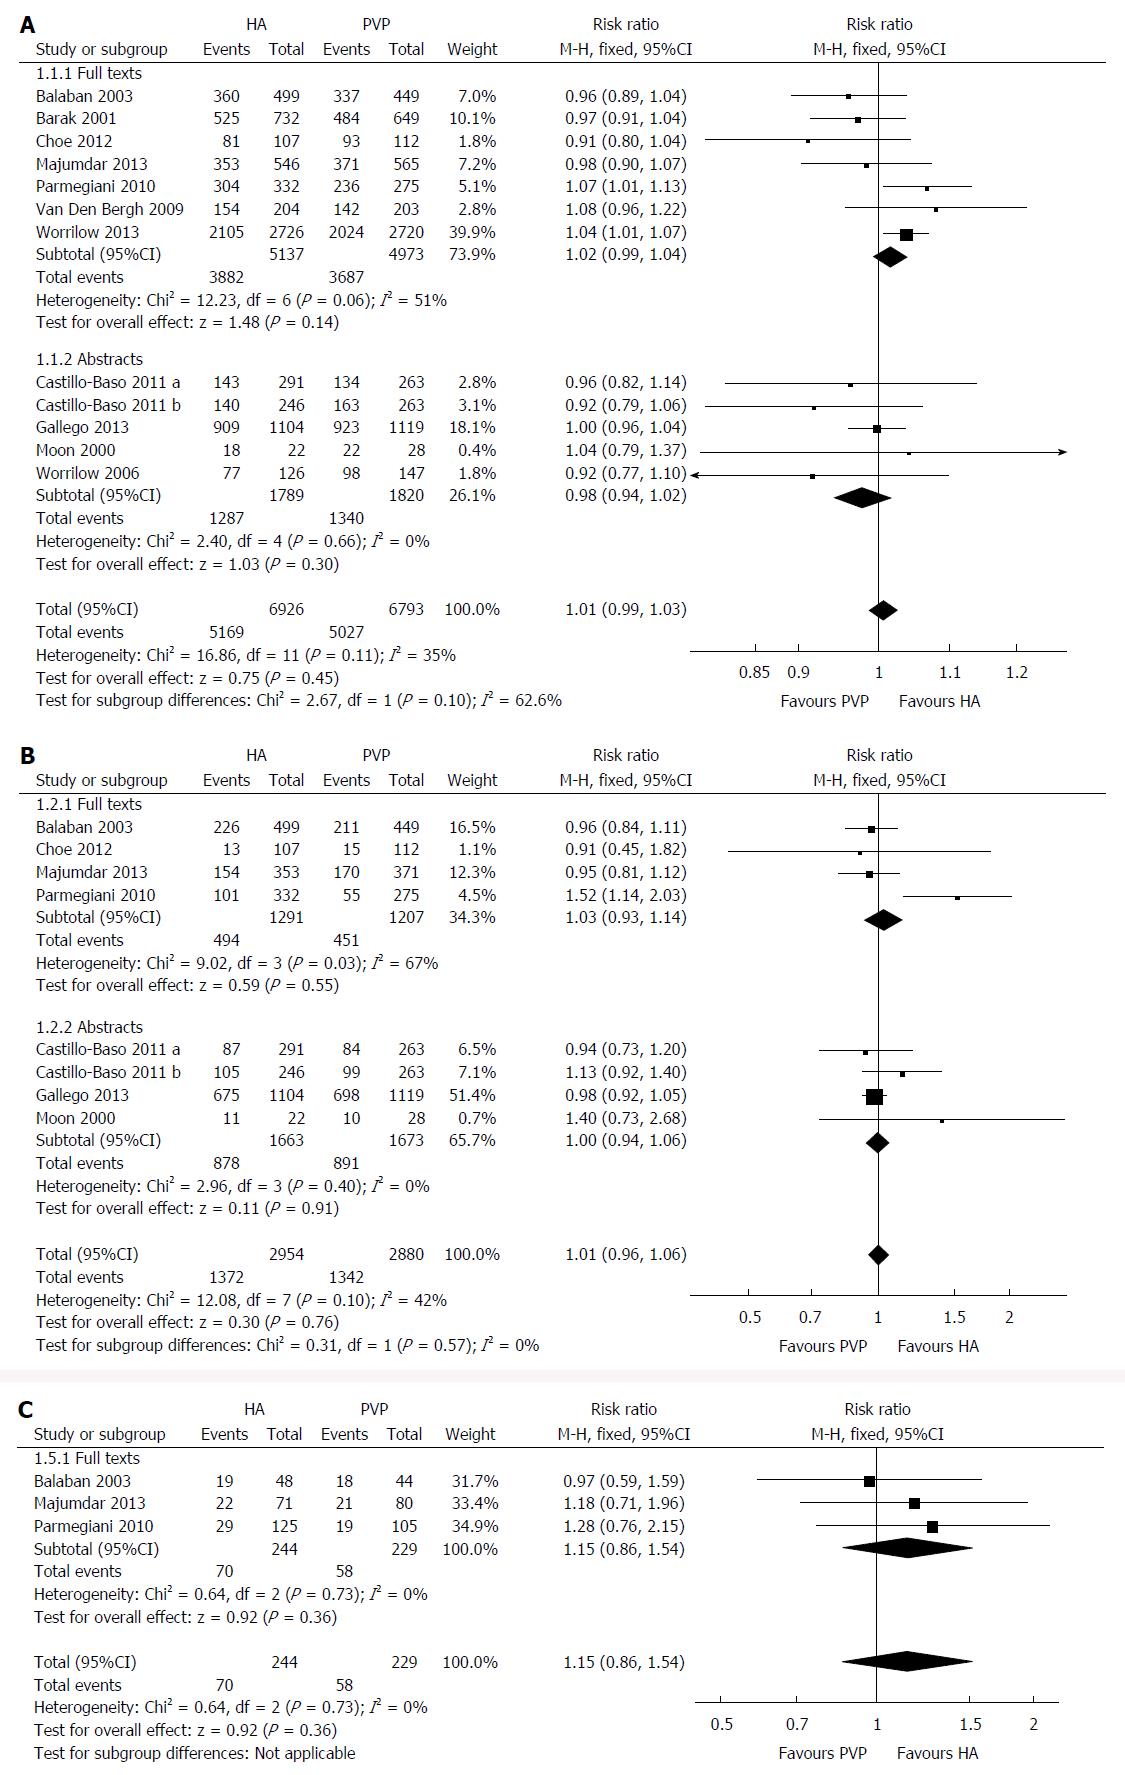
Figure 4 Primary endpoints.
A: The forest plot showing fertilisation rate per oocyte injected. Risk ratio is shown with 95%CI; B: The forest plot showing good embryos rate per oocyte injected, risk ratio is shown with 95%CI; C: The forest plot showing live birth rate per cycle. Risk ratio is shown with 95%CI. HA: Hyaluronic acid; PVP: Polyvinylpyrrolidone.
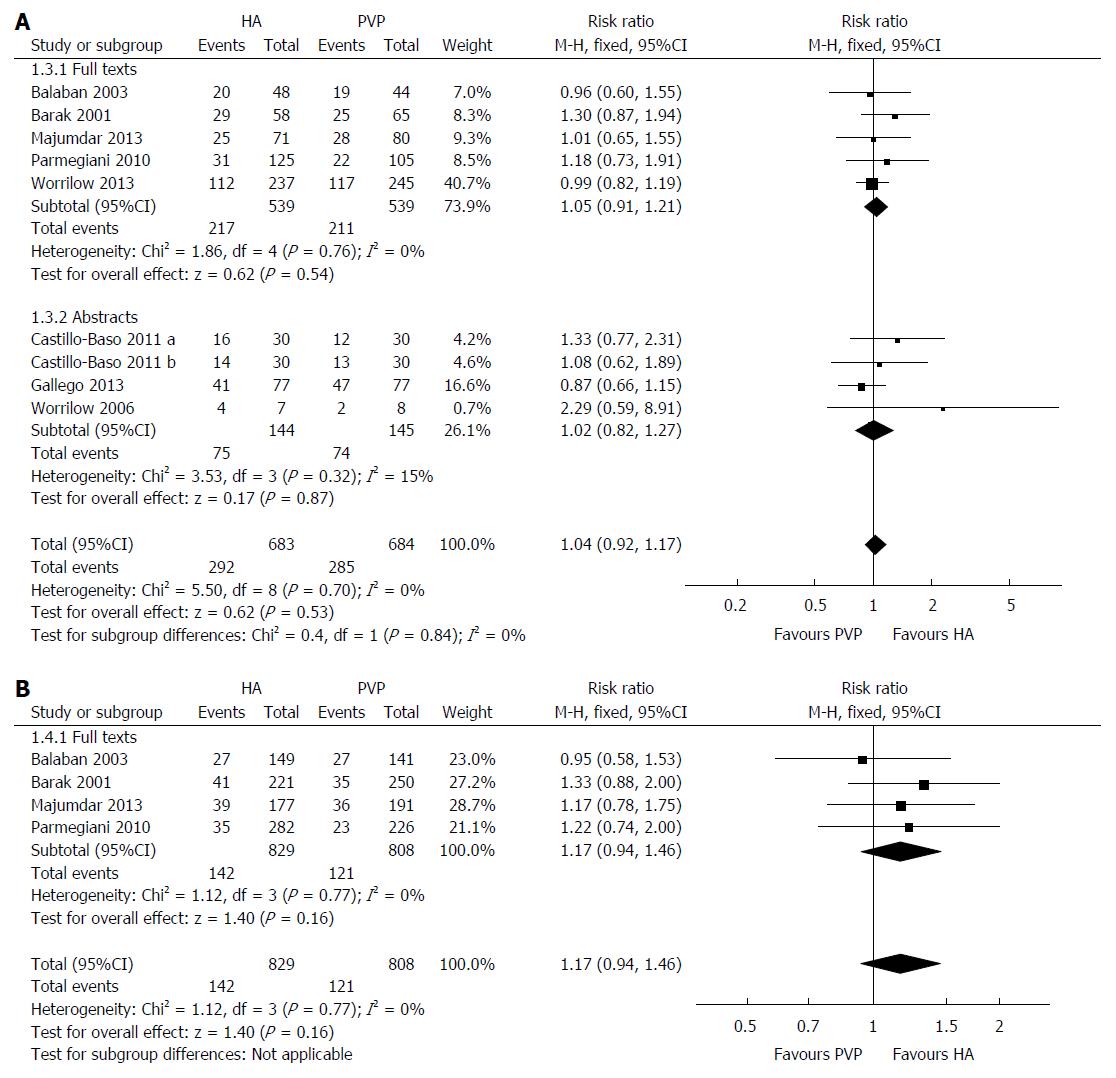
Figure 5 Secondary endpoints.
A: The forest plot showing clinical pregnancy rate per transfer. Risk ratio is shown with 95%CI; B: The forest plot showing implantation rate per embryo transferred. Risk ratio is shown with 95%CI. HA: Hyaluronic acid; PVP: Polyvinylpyrrolidone.
- Citation: Craciunas L, Tsampras N, Kollmann M, Stirbu L, Raine-Fenning NJ. Use of hyaluronic acid for sperm immobilisation and selection before intracytoplasmic sperm injection: A systematic review and meta-analysis. World J Obstet Gynecol 2015; 4(4): 113-123
- URL: https://www.wjgnet.com/2218-6220/full/v4/i4/113.htm
- DOI: https://dx.doi.org/10.5317/wjog.v4.i4.113


