Copyright
©2014 Baishideng Publishing Group Co.
World J Obstet Gynecol. Feb 10, 2014; 3(1): 21-25
Published online Feb 10, 2014. doi: 10.5317/wjog.v3.i1.21
Published online Feb 10, 2014. doi: 10.5317/wjog.v3.i1.21
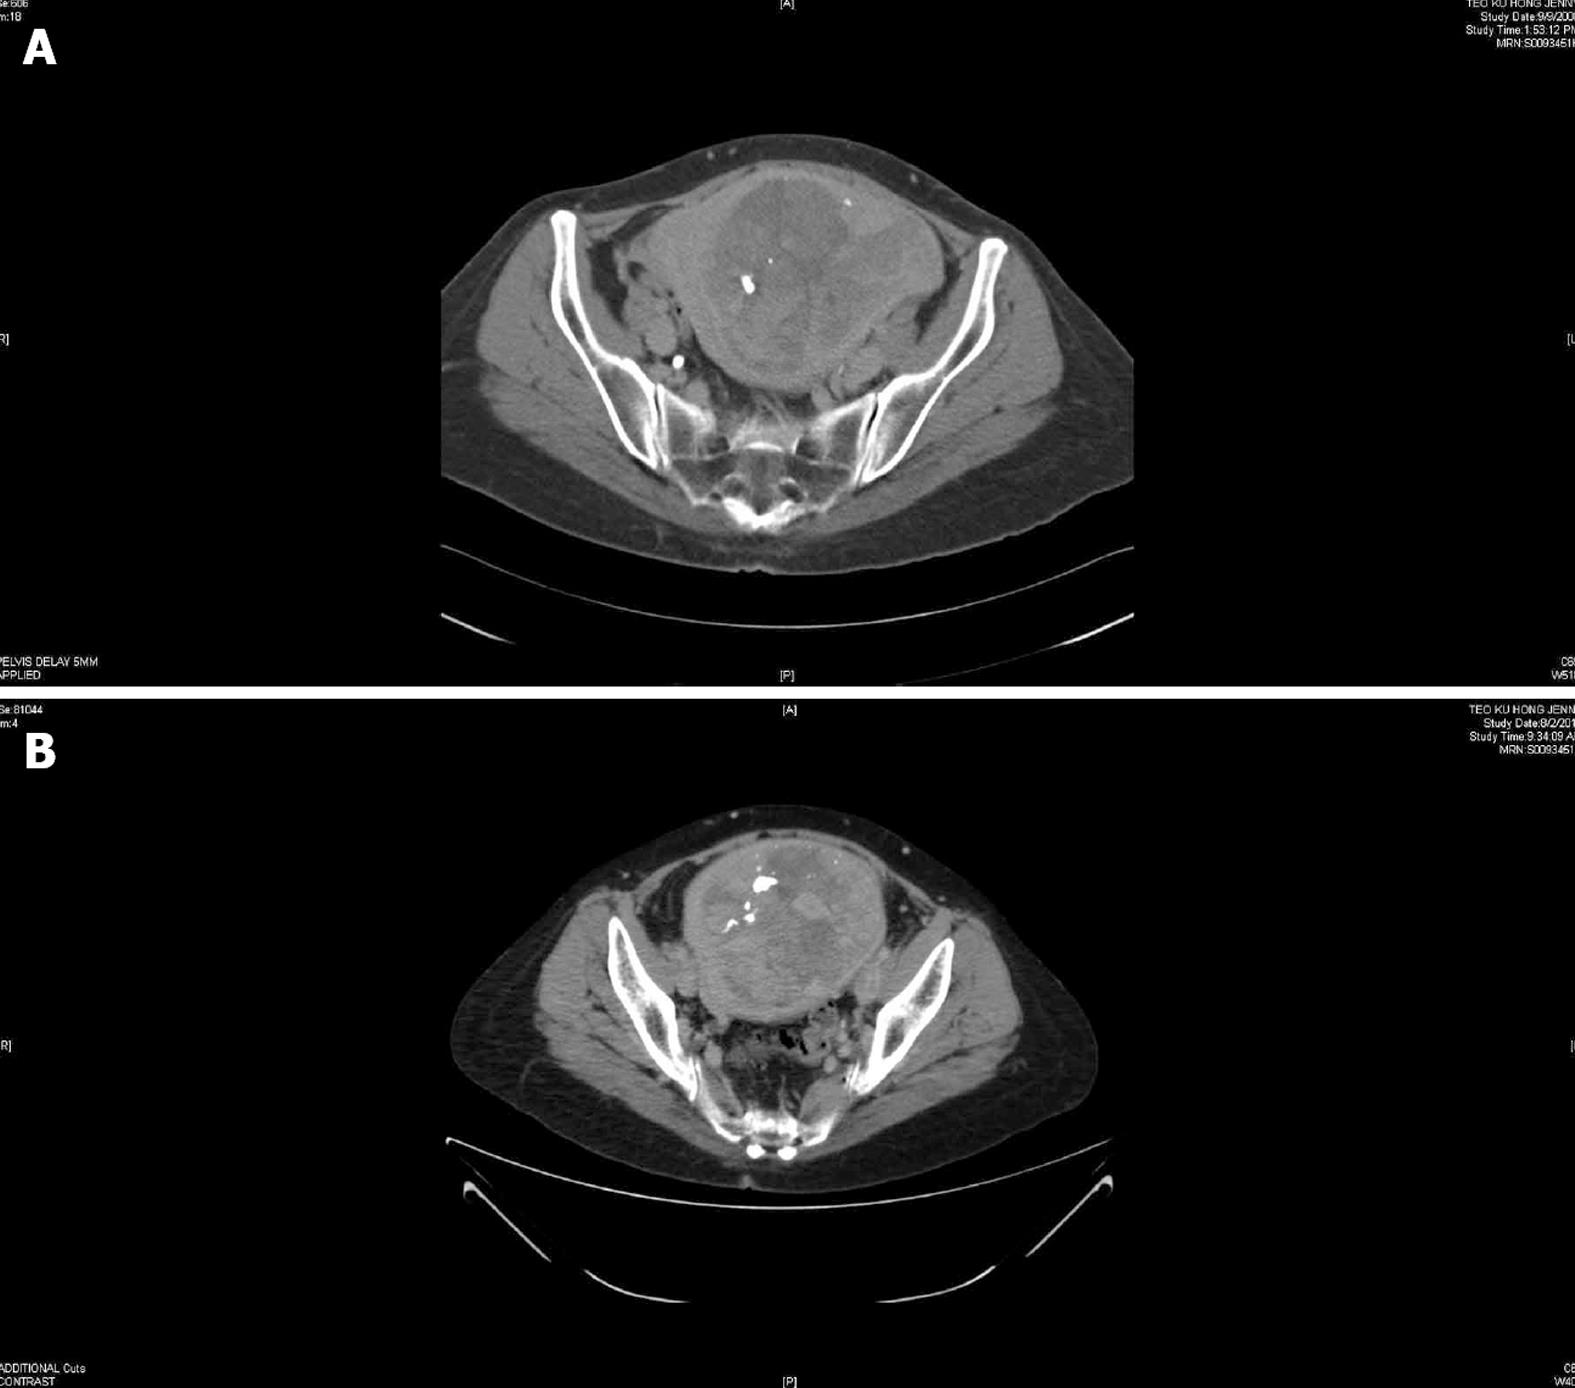
Figure 1 Computed tomography scan of the pelvis showing fibroid uterus.
A: August 2008; B: September 2012.
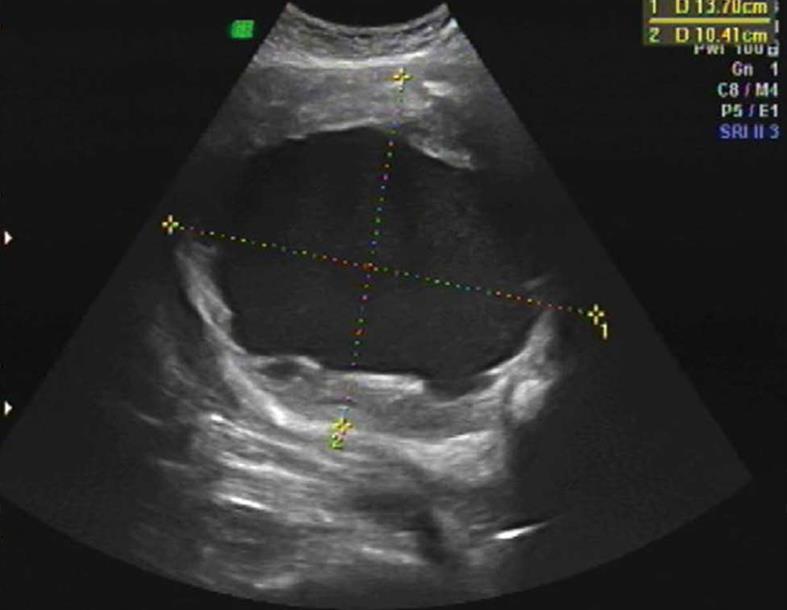
Figure 2 Transabdominal ultrasound showing fibroid with cystic degeneration.
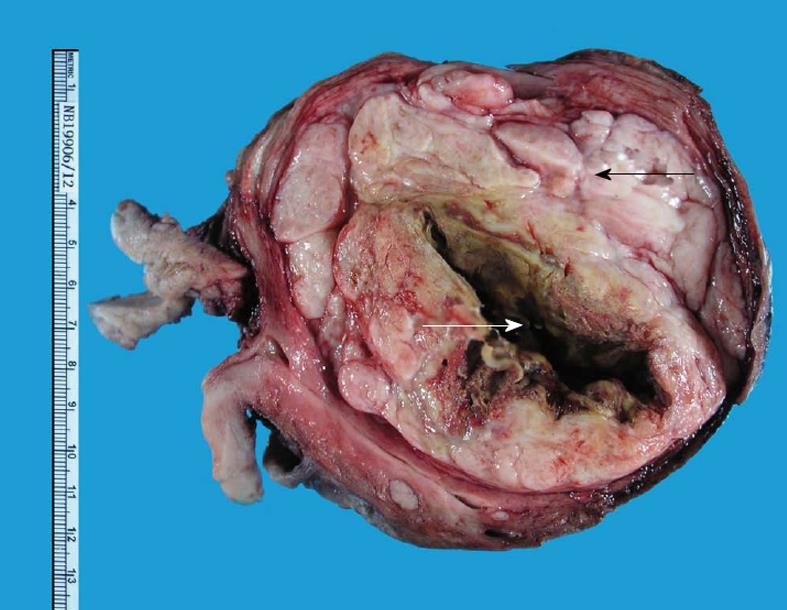
Figure 3 Hysterectomy specimen showing myometrial fibroid (black arrow) with cystic cavity (white arrow).
Figure 4 Histopathology.
A: Tumour cells (white arrow) surrounding cystic cavity and the leiomyoma (black arrow); B: Sheets of malignant cells and those staining positive for thyroid transcription factor-1 (inset).
- Citation: Rauff S, Ng JS, Ilancheran A. Metastasis to a uterine leiomyoma originating from lung cancer: A case report. World J Obstet Gynecol 2014; 3(1): 21-25
- URL: https://www.wjgnet.com/2218-6220/full/v3/i1/21.htm
- DOI: https://dx.doi.org/10.5317/wjog.v3.i1.21


