
















Copyright: ©Author(s) 2026.
Artif Intell Gastrointest Endosc. Sep 8, 2026; 7(2): 121644
Published online Sep 8, 2026. doi: 10.37126/aige.121644
Published online Sep 8, 2026. doi: 10.37126/aige.121644
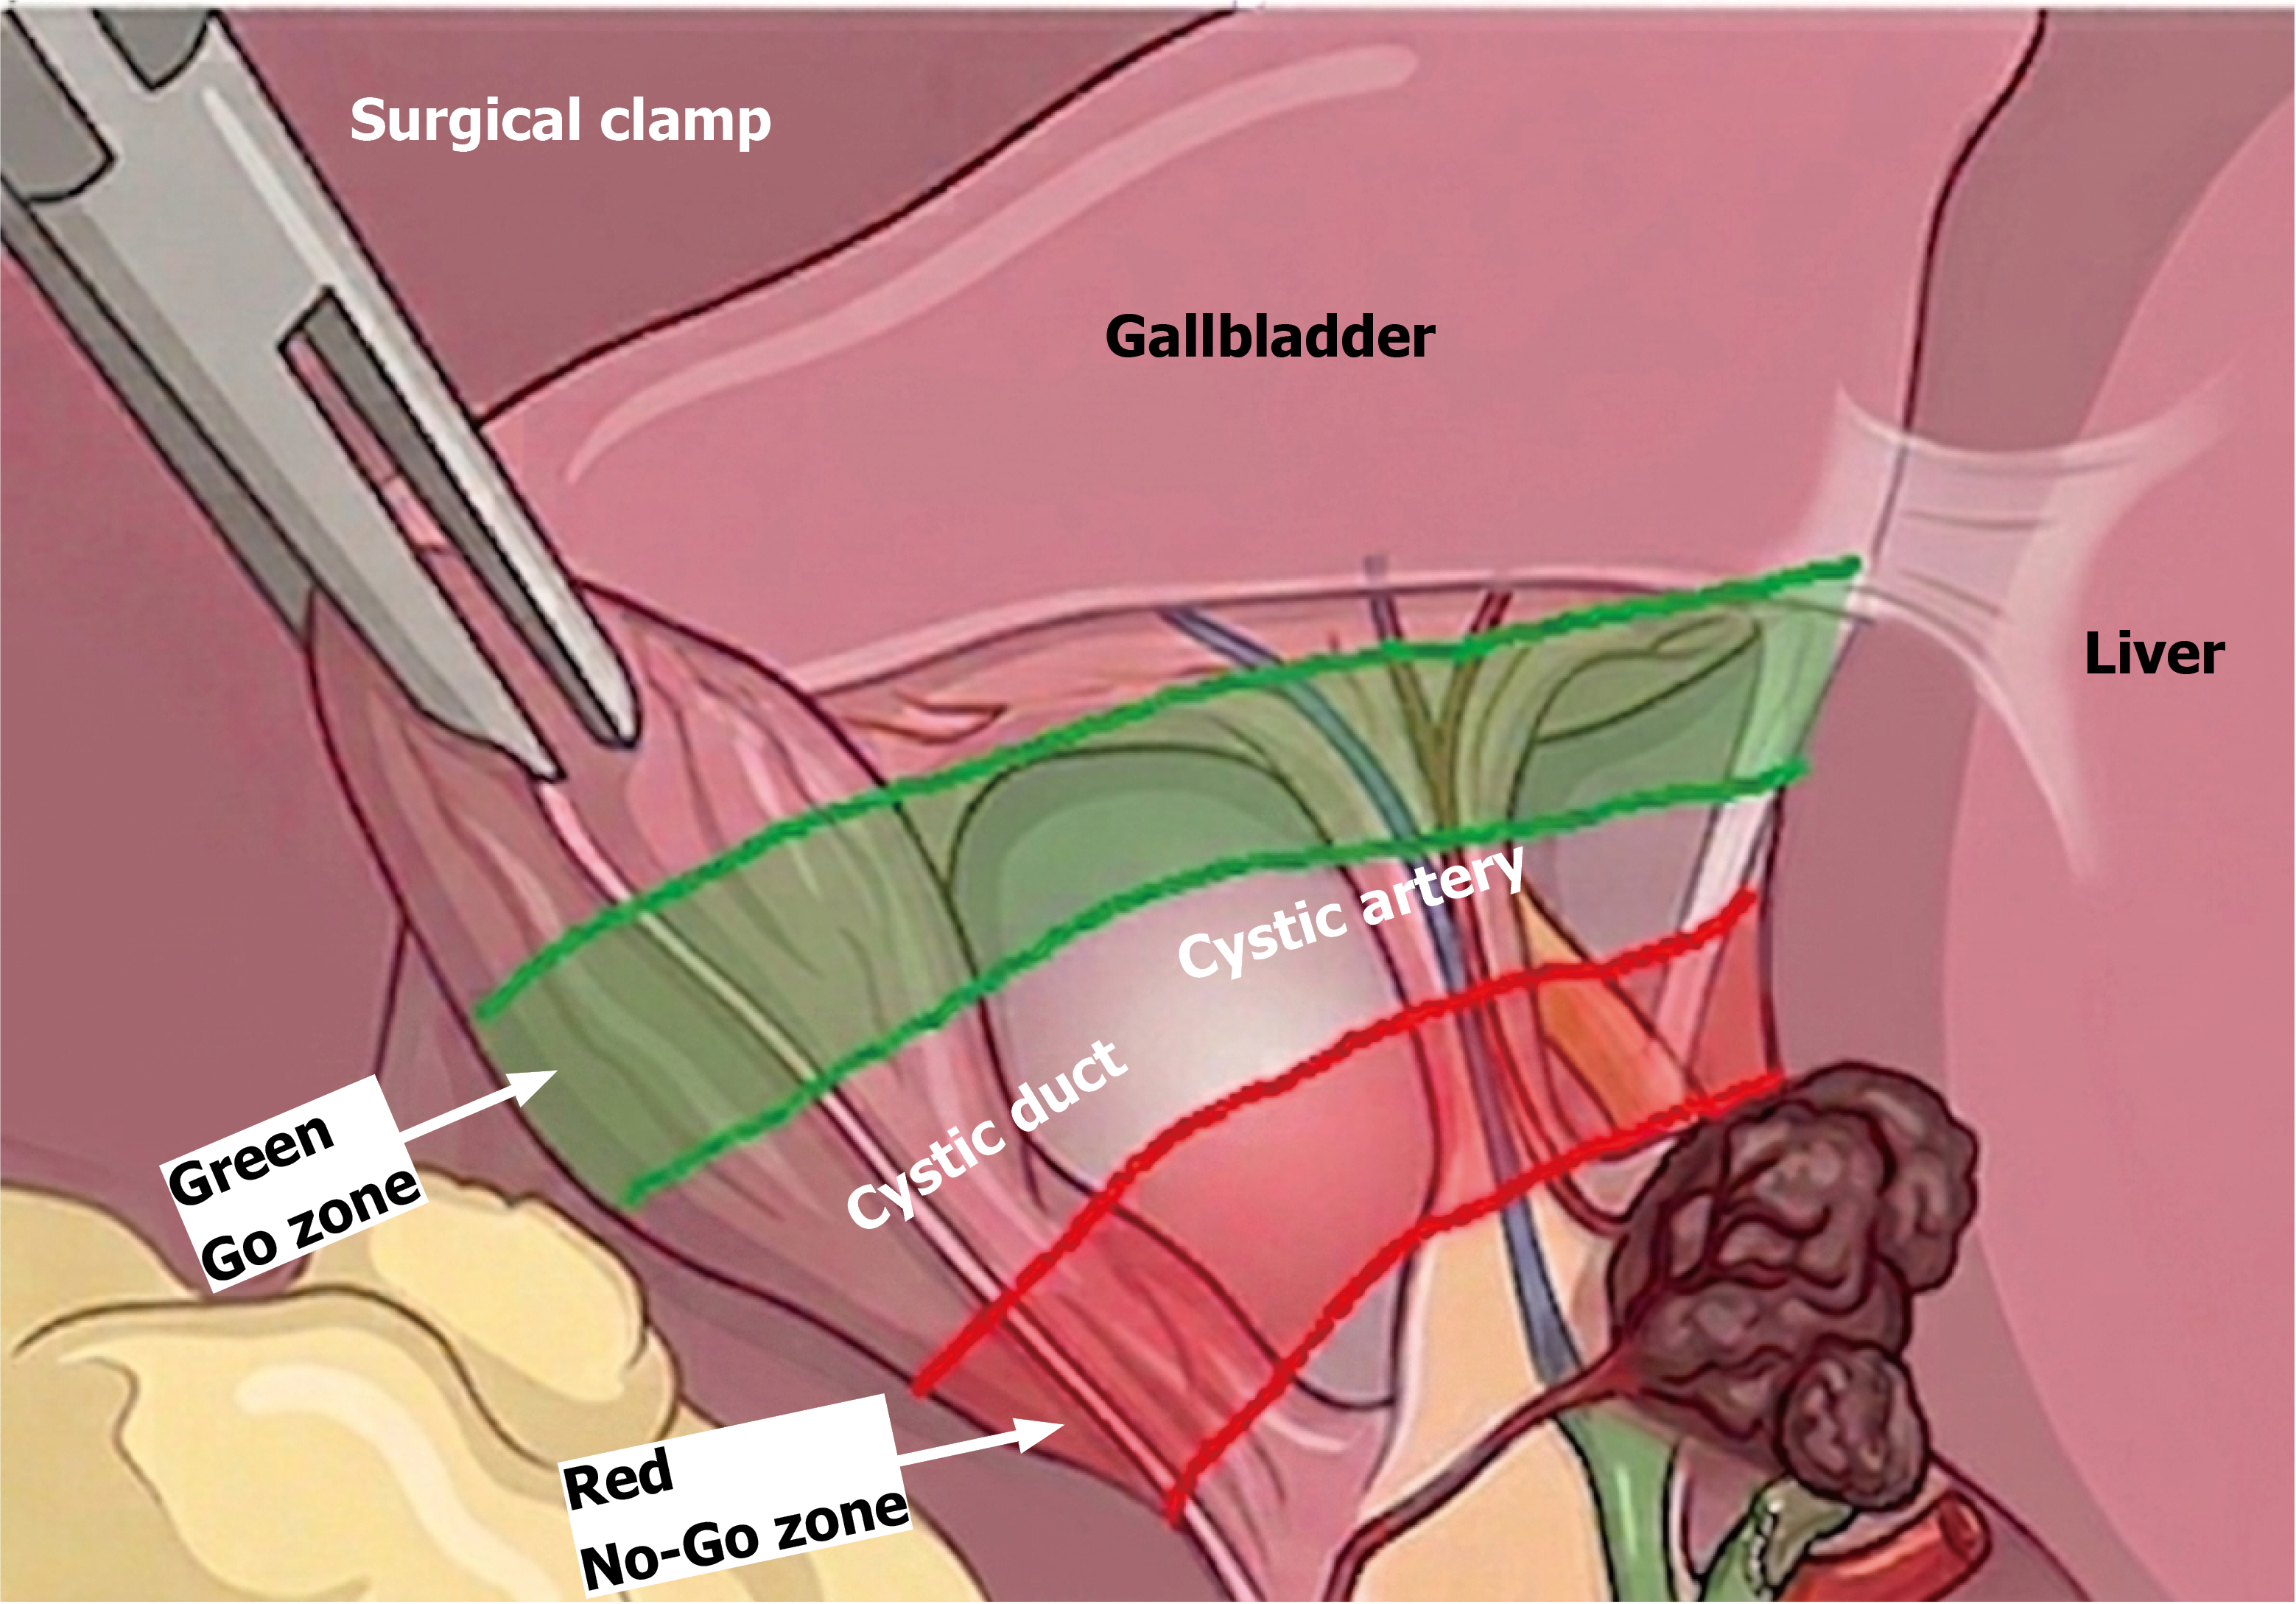
Figure 4
Schematic representation depicting mapping of Safe (Go) and unsafe (No-Go) zones in hepatocystic triangle (please note this is an illustration to show how heat maps are being used to delineate these zones and not an accurately scaled image).
- Citation: Hazrah P, Rautela VS, Sharma V, Mittal S, Madan RR, Sharma D. Improving precision of laparoscopic cholecystectomy: A review on the role of newer intraoperative imaging aids and artificial intelligence. Artif Intell Gastrointest Endosc 2026; 7(2): 121644
- URL: https://www.wjgnet.com/2689-7164/full/v7/i2/121644.htm
- DOI: https://dx.doi.org/10.37126/aige.121644