Copyright
©The Author(s) 2020.
Artif Intell Med Imaging. Jun 28, 2020; 1(1): 40-49
Published online Jun 28, 2020. doi: 10.35711/aimi.v1.i1.40
Published online Jun 28, 2020. doi: 10.35711/aimi.v1.i1.40
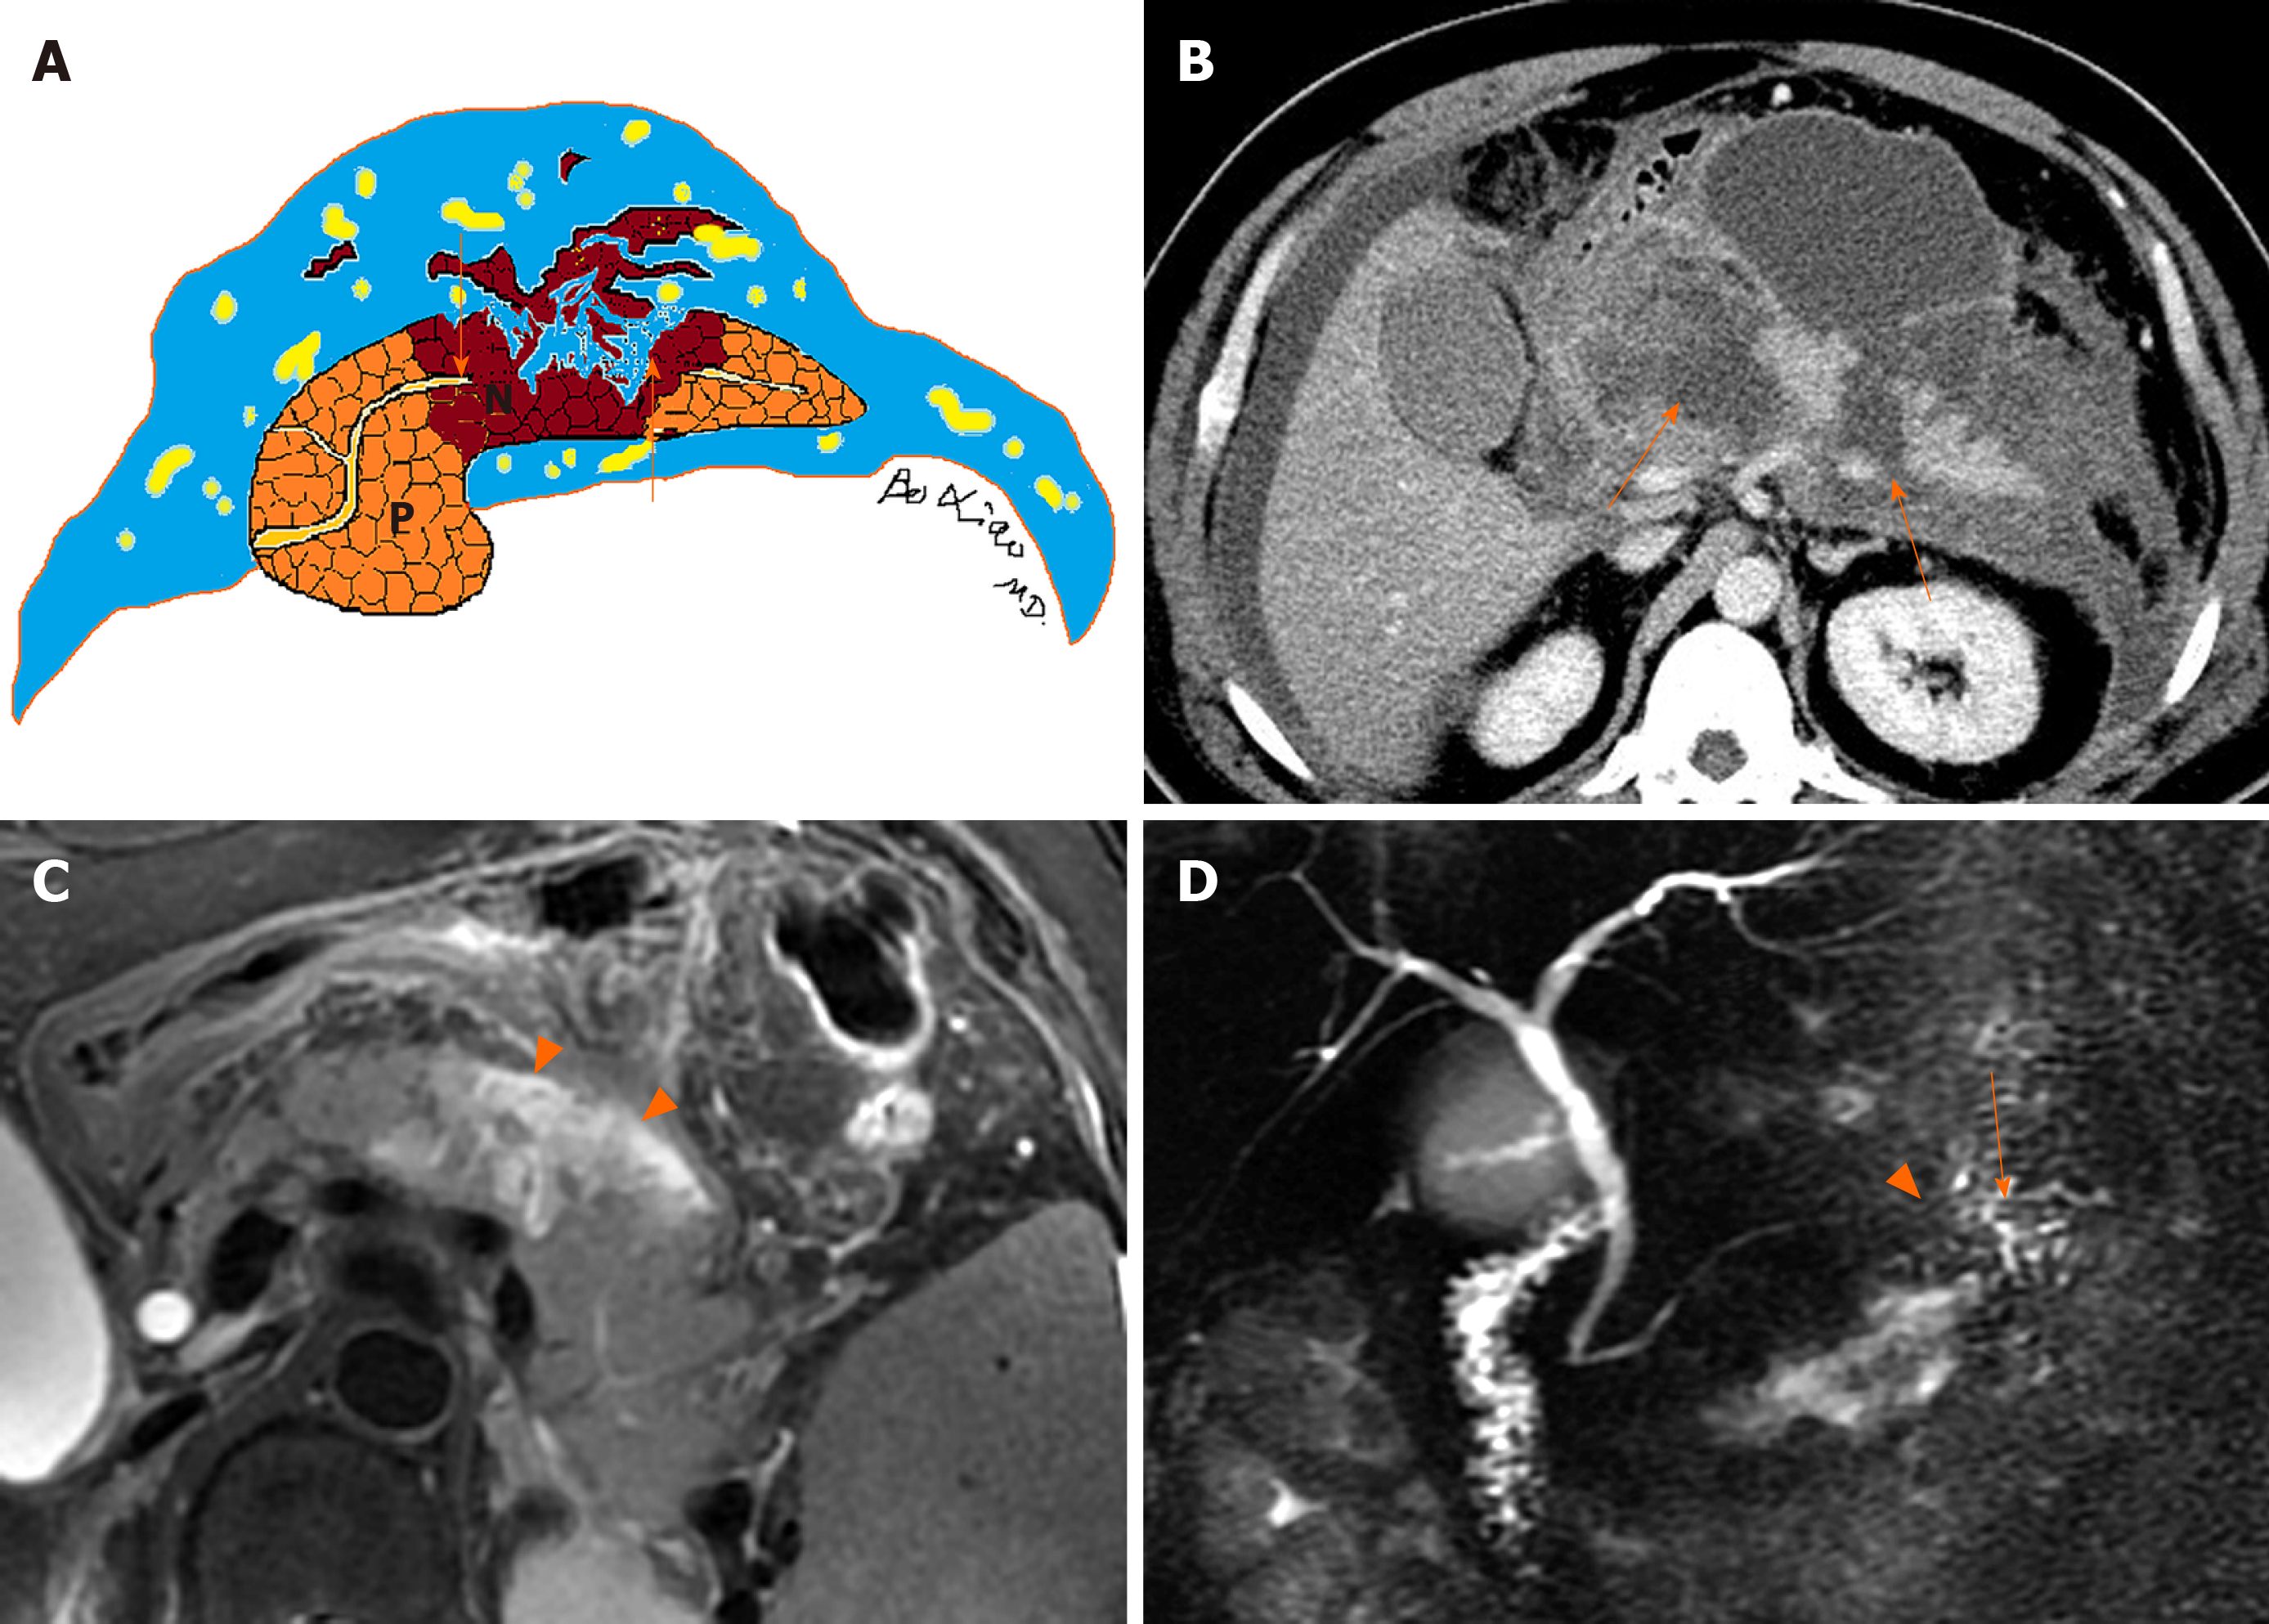
Figure 8 Schematic diagram of disconnected pancreatic duct syndrome and medical images of patients.
A: Schematic diagram of disconnected pancreatic duct syndrome. The pancreatic duct rupture and interruption (arrows) resulting from a wide range of liquefied pancreatic body tissue is seen; B: A 60-year-old man with necrotizing pancreatitis. Axial contrast-enhanced computed tomography image in the venous phase shows extensive parenchymal transmural necrosis (arrows) in the region of neck and body of the pancreas. Disconnected main pancreatic duct was proved at surgery; C: A 57-year-old woman with necrotizing pancreatitis. Magnetic resonance imaging axial T2WI image shows a majority of liquefied necroses (arrowheads) in the pancreatic body; D: The main pancreatic duct (arrow) of the tail of pancreas is interrupted (arrowhead) by the mentioned-above lesion. P: Pancreas; N: Necrosis.
- Citation: Xiao B. Acute pancreatitis: A pictorial review of early pancreatic fluid collections. Artif Intell Med Imaging 2020; 1(1): 40-49
- URL: https://www.wjgnet.com/2644-3260/full/v1/i1/40.htm
- DOI: https://dx.doi.org/10.35711/aimi.v1.i1.40


