Copyright
©The Author(s) 2021.
World J Clin Cases. Mar 6, 2021; 9(7): 1661-1667
Published online Mar 6, 2021. doi: 10.12998/wjcc.v9.i7.1661
Published online Mar 6, 2021. doi: 10.12998/wjcc.v9.i7.1661
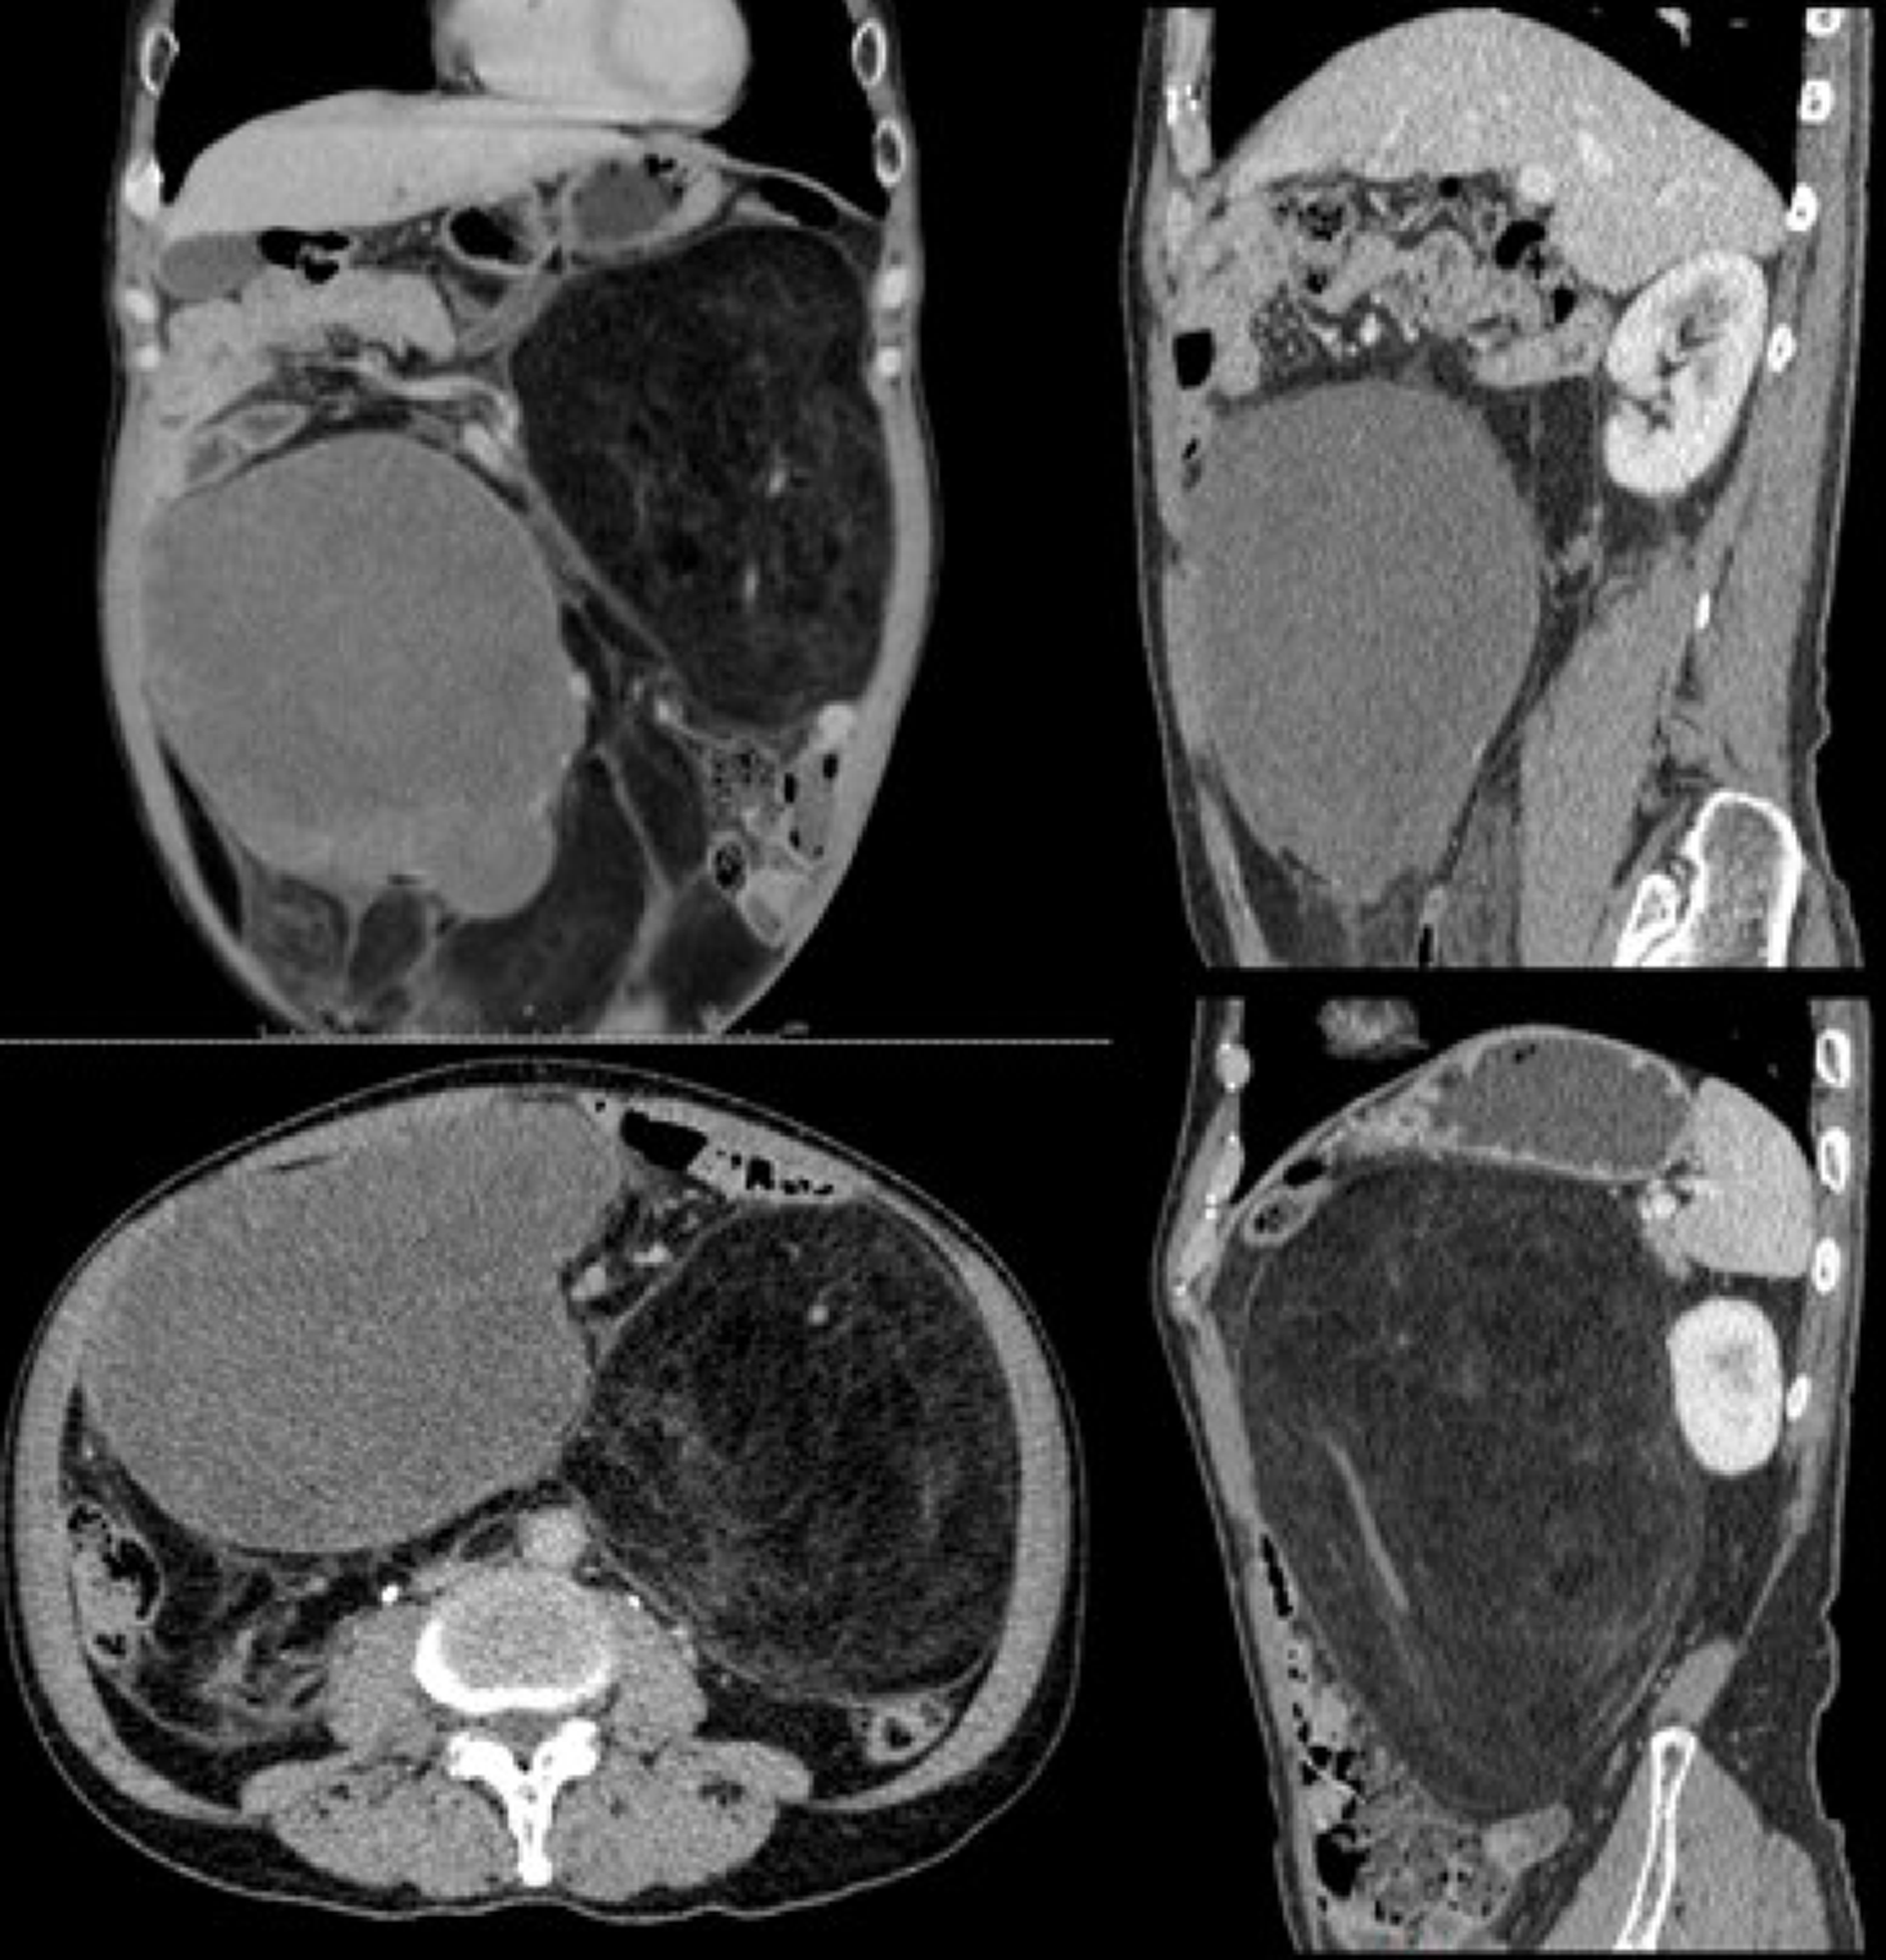
Figure 2 Abdominal-pelvic computed tomography showing two masses.
The left one exhibited a fat-like density with a -65 HU value, a clear boundary, and a convoluted vascular course, and contrast-enhanced scanning did not show significant enhancement; the right one had a mixed density, and contrast-enhanced scanning yielded the following computed tomography values during the three phases: 28/31/50 HU.
- Citation: Xie TH, Ren XX, Fu Y, Ha SN, Liu LT, Jin XS. Multiple well-differentiated retroperitoneal liposarcomas with different patterns of appearance on computed tomography: A case report. World J Clin Cases 2021; 9(7): 1661-1667
- URL: https://www.wjgnet.com/2307-8960/full/v9/i7/1661.htm
- DOI: https://dx.doi.org/10.12998/wjcc.v9.i7.1661


