Copyright
©The Author(s) 2021.
World J Clin Cases. Mar 6, 2021; 9(7): 1563-1579
Published online Mar 6, 2021. doi: 10.12998/wjcc.v9.i7.1563
Published online Mar 6, 2021. doi: 10.12998/wjcc.v9.i7.1563
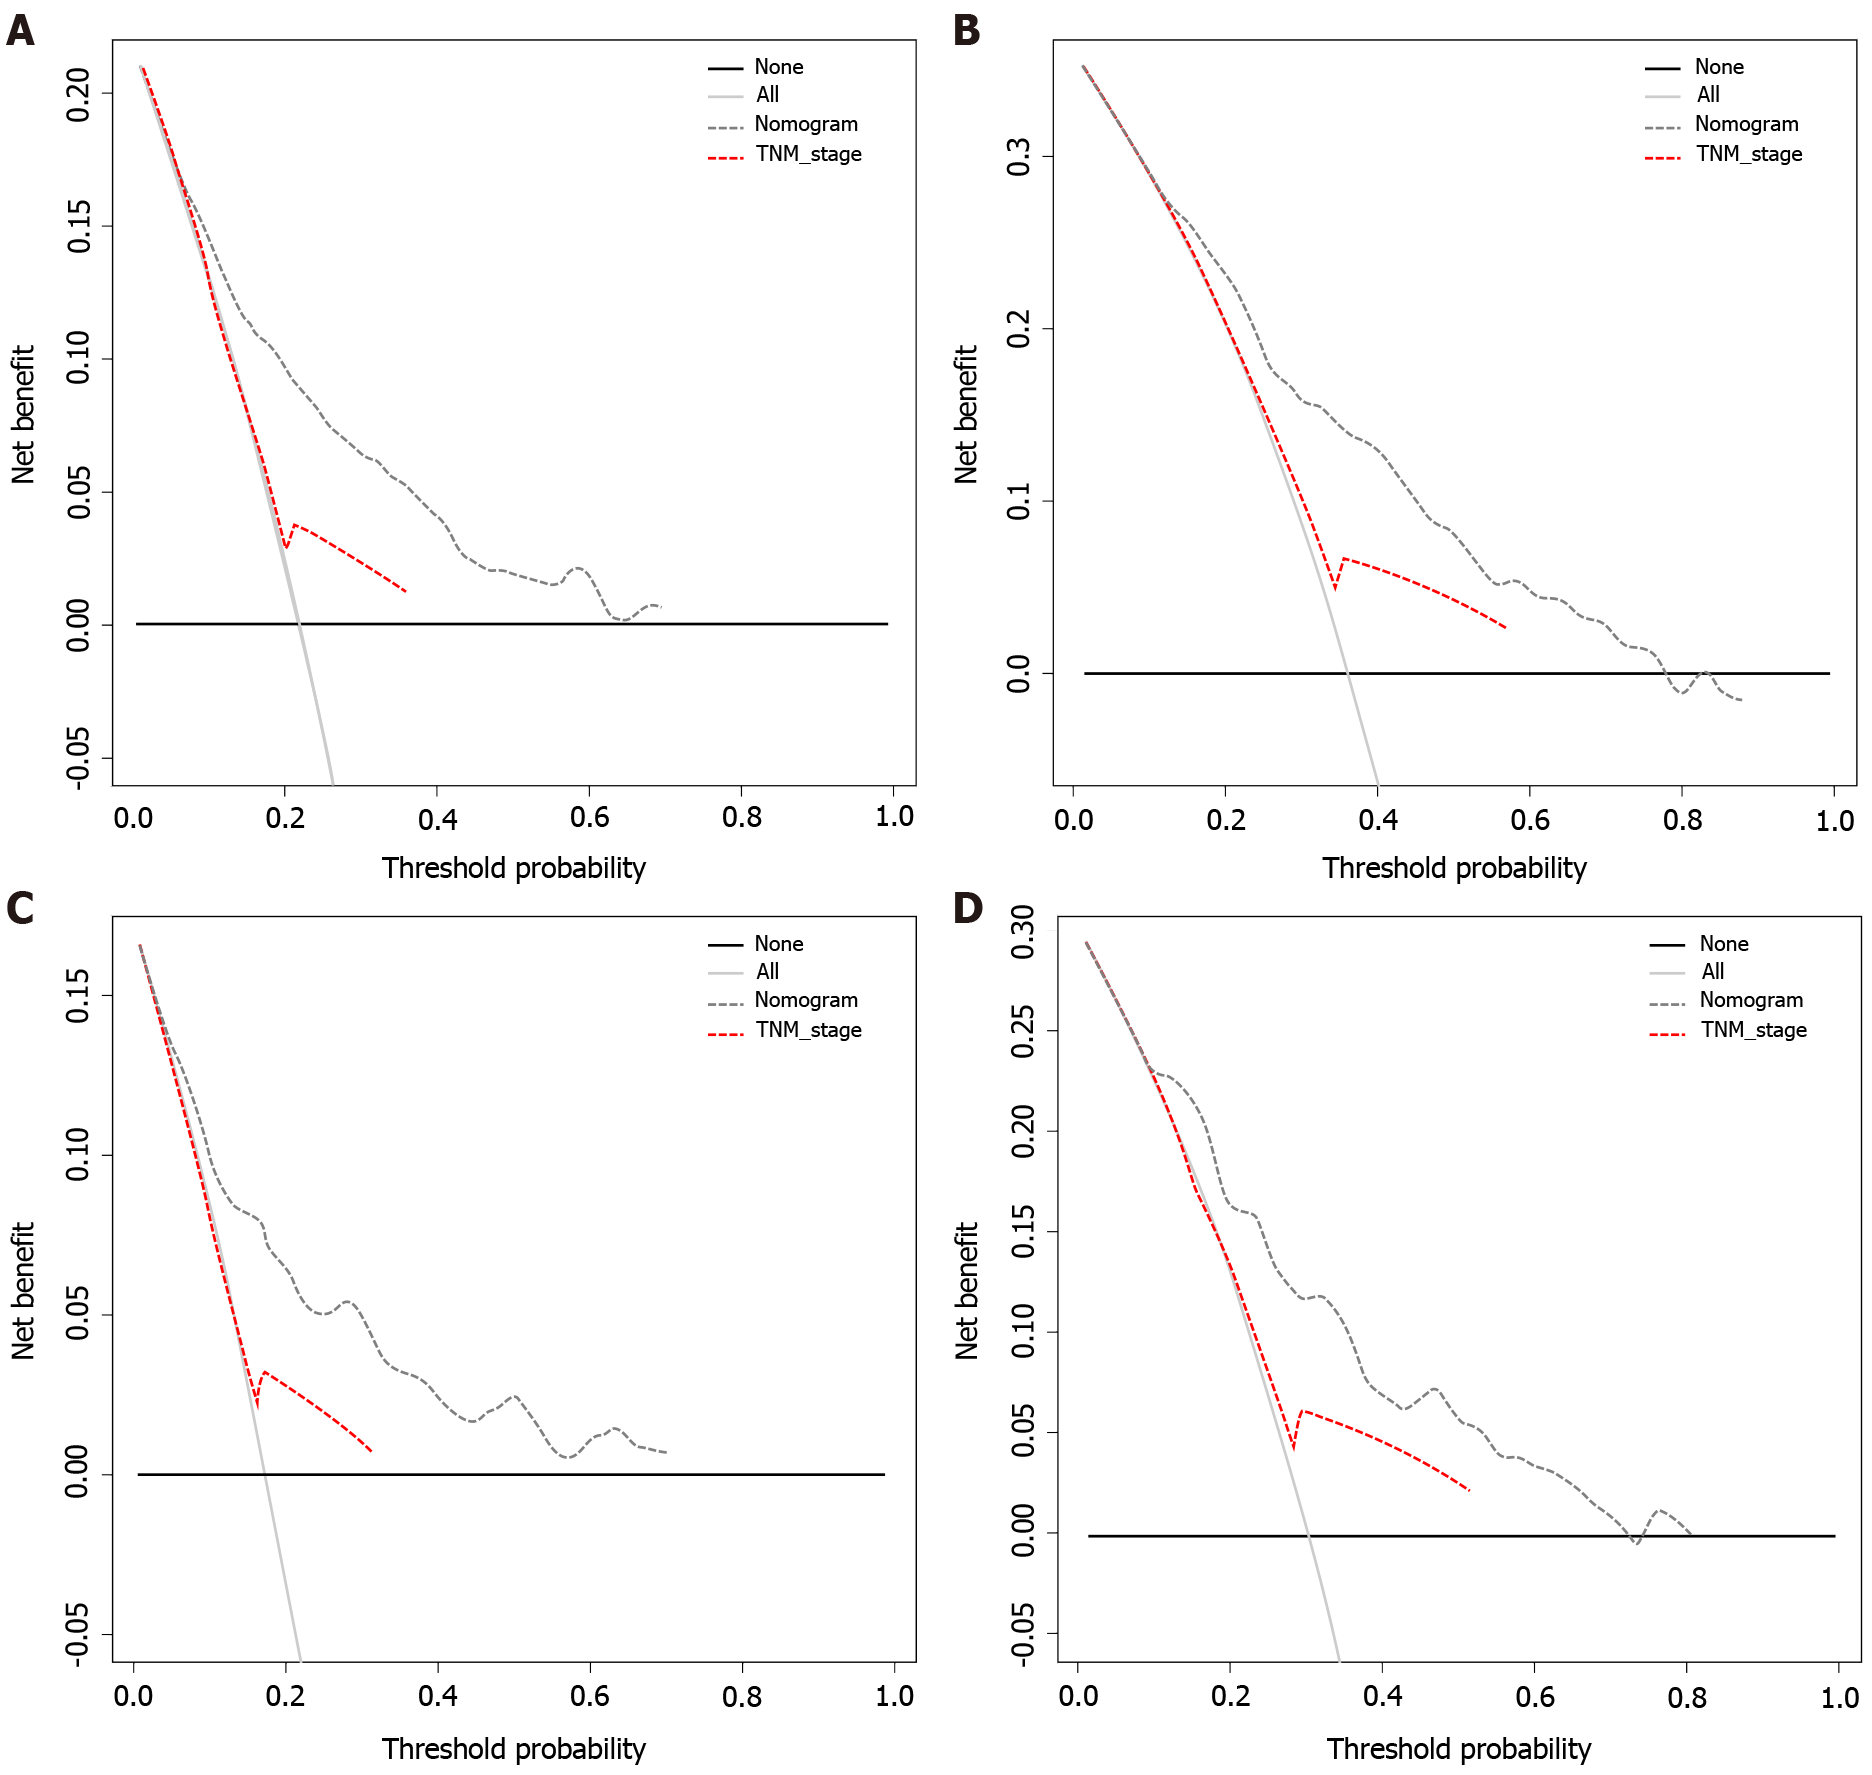
Figure 5 Decision curve analysis.
Plot net benefit vs threshold probability. The net benefit was calculated by subtracting the proportion of all false-positive patients from the proportion of true positives, weighing the relative harm of abandoning treatment against the adverse consequences of unnecessary treatment. The gray and black lines indicate the net benefit of treating all patients and no patient strategies, respectively. Dashed lines represent the nomograms. The results showed that the nomograms had good decision power in the validation cohort. A: 3 Year overall survival (OS) decision curve analysis (DCA); B: 5 Year OS DCA; C: 3 Year CSS DCA; D: 5 Year CSS DCA. TNM: Tumor-node-metastases.
- Citation: Liu H, Li Y, Qu YD, Zhao JJ, Zheng ZW, Jiao XL, Zhang J. Construction of a clinical survival prognostic model for middle-aged and elderly patients with stage III rectal adenocarcinoma . World J Clin Cases 2021; 9(7): 1563-1579
- URL: https://www.wjgnet.com/2307-8960/full/v9/i7/1563.htm
- DOI: https://dx.doi.org/10.12998/wjcc.v9.i7.1563


