Copyright
©The Author(s) 2021.
World J Clin Cases. Feb 26, 2021; 9(6): 1416-1423
Published online Feb 26, 2021. doi: 10.12998/wjcc.v9.i6.1416
Published online Feb 26, 2021. doi: 10.12998/wjcc.v9.i6.1416
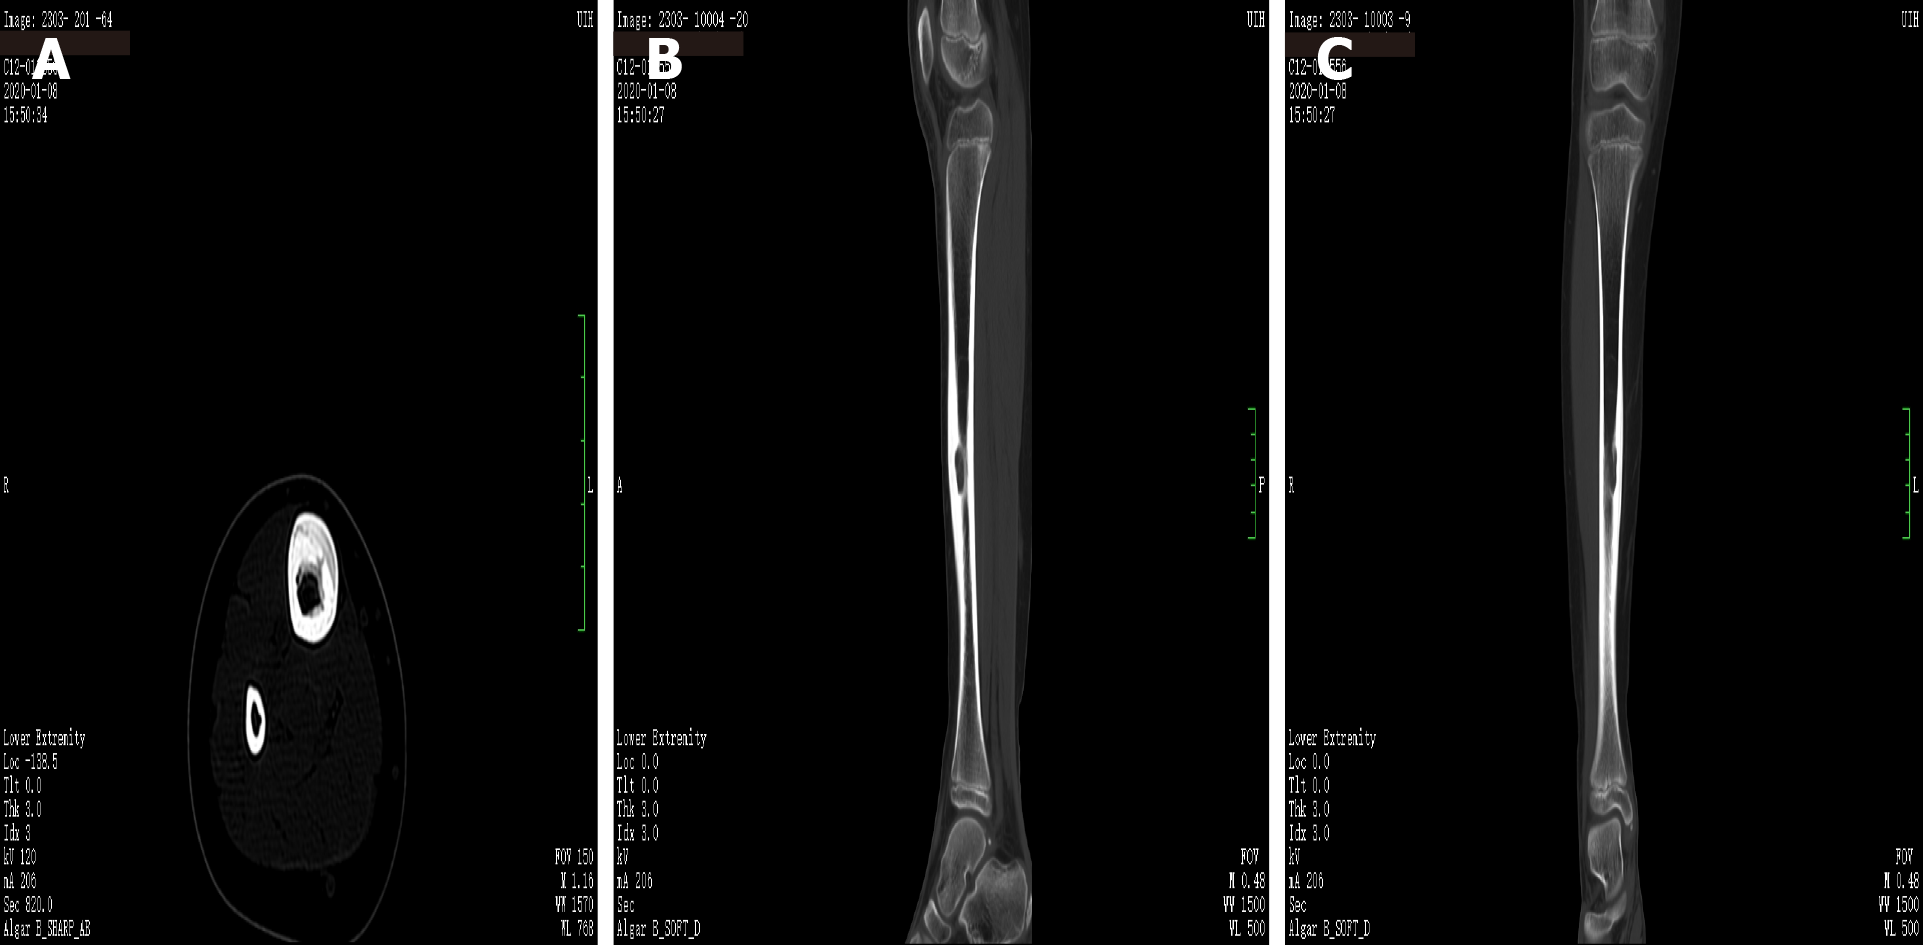
Figure 2 Computed tomography images of the tibia.
A: Axial computed tomography image showing the purely osteolytic lesion of the right tibia; B and C: Coronal computed tomography images showing a similar round cystic bone defect area with a sclerotic margin, the range was about 10 mm × 9 mm × 18 mm, the adjacent bone cortex was obviously thickened, periosteal reaction was visible, and no definite swelling was found in the surrounding soft tissue.
- Citation: Vithran DTA, Wang JZ, Xiang F, Wen J, Xiao S, Tang WZ, Chen Q. Osseous Rosai-Dorfman disease of tibia in children: A case report. World J Clin Cases 2021; 9(6): 1416-1423
- URL: https://www.wjgnet.com/2307-8960/full/v9/i6/1416.htm
- DOI: https://dx.doi.org/10.12998/wjcc.v9.i6.1416


