Copyright
©The Author(s) 2021.
World J Clin Cases. Dec 6, 2021; 9(34): 10566-10575
Published online Dec 6, 2021. doi: 10.12998/wjcc.v9.i34.10566
Published online Dec 6, 2021. doi: 10.12998/wjcc.v9.i34.10566
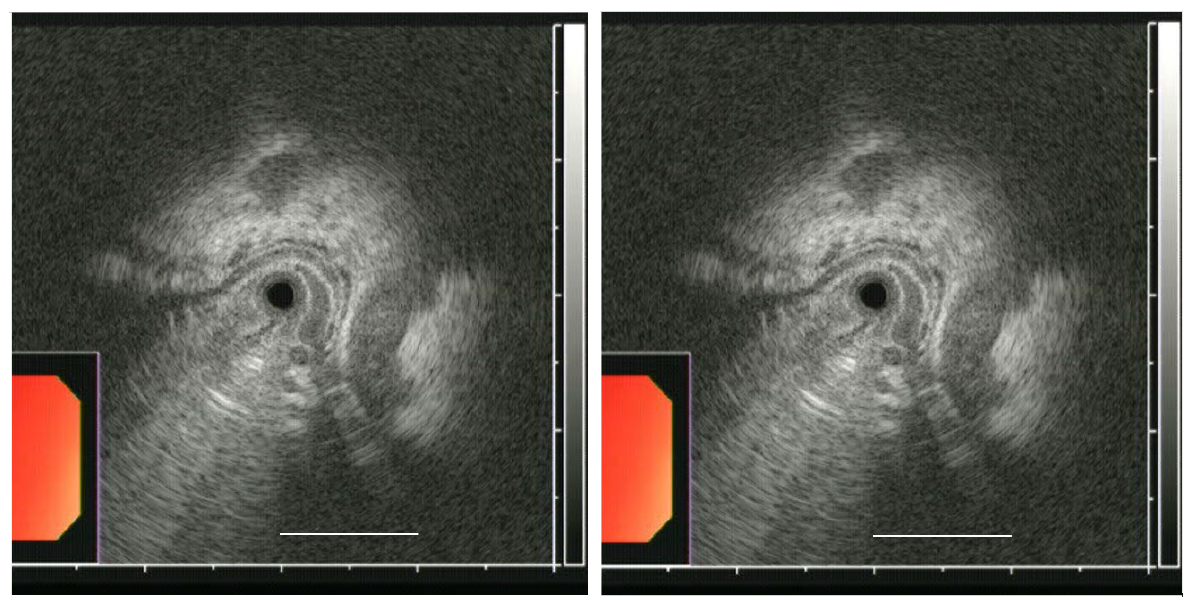
Figure 1 High-frequency intraluminal ultrasound images of post-endoscopic variceal ligation of type 1 gastric varices.
The post-endoscopic variceal ligation sizes of varices were assessed according to the largest cross-sectional area (CSA). CSA was measured between the hypoechoic blood-filled lumen and the hyperechoic submucosa or mucosa. The dotted line indicates the largest CSA of the varix. The scale bar represents 10 mm.
- Citation: Kim JH, Choe WH, Lee SY, Kwon SY, Sung IK, Park HS. Comparative study for predictability of type 1 gastric variceal rebleeding after endoscopic variceal ligation: High-frequency intraluminal ultrasound study. World J Clin Cases 2021; 9(34): 10566-10575
- URL: https://www.wjgnet.com/2307-8960/full/v9/i34/10566.htm
- DOI: https://dx.doi.org/10.12998/wjcc.v9.i34.10566


