Copyright
©The Author(s) 2021.
World J Clin Cases. Nov 16, 2021; 9(32): 9990-9996
Published online Nov 16, 2021. doi: 10.12998/wjcc.v9.i32.9990
Published online Nov 16, 2021. doi: 10.12998/wjcc.v9.i32.9990
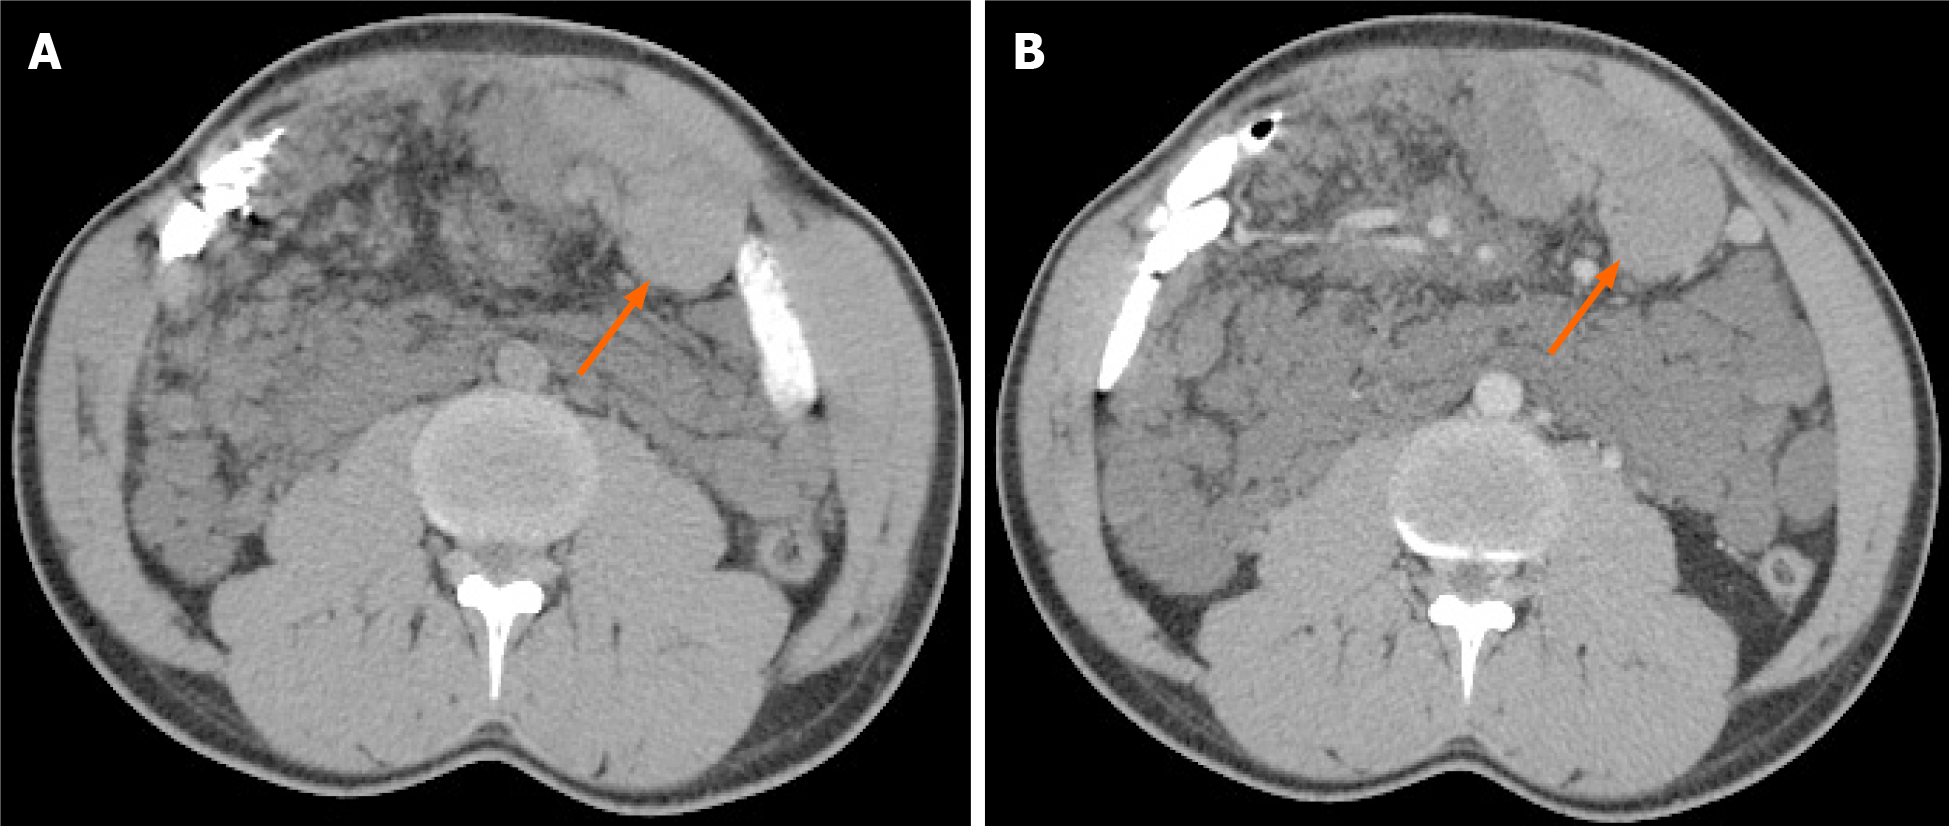
Figure 3 Computed tomography image of intra-cystic hemorrhage.
A: Non-enhanced axial computed tomography scan of the abdomen shows hemorrhage within one of the cystic lesions (orange arrow) located at the left lower quadrant with a spontaneous density of 53 Hounsfield units; B: Portal-venous phase axial contrast-enhanced image at the same level shows no internal enhancement within the lesion after administration of intravenous contrast.
- Citation: Alhasan AS, Daqqaq TS. Extensive abdominal lymphangiomatosis involving the small bowel mesentery: A case report. World J Clin Cases 2021; 9(32): 9990-9996
- URL: https://www.wjgnet.com/2307-8960/full/v9/i32/9990.htm
- DOI: https://dx.doi.org/10.12998/wjcc.v9.i32.9990


