Copyright
©The Author(s) 2021.
World J Clin Cases. Nov 6, 2021; 9(31): 9670-9679
Published online Nov 6, 2021. doi: 10.12998/wjcc.v9.i31.9670
Published online Nov 6, 2021. doi: 10.12998/wjcc.v9.i31.9670
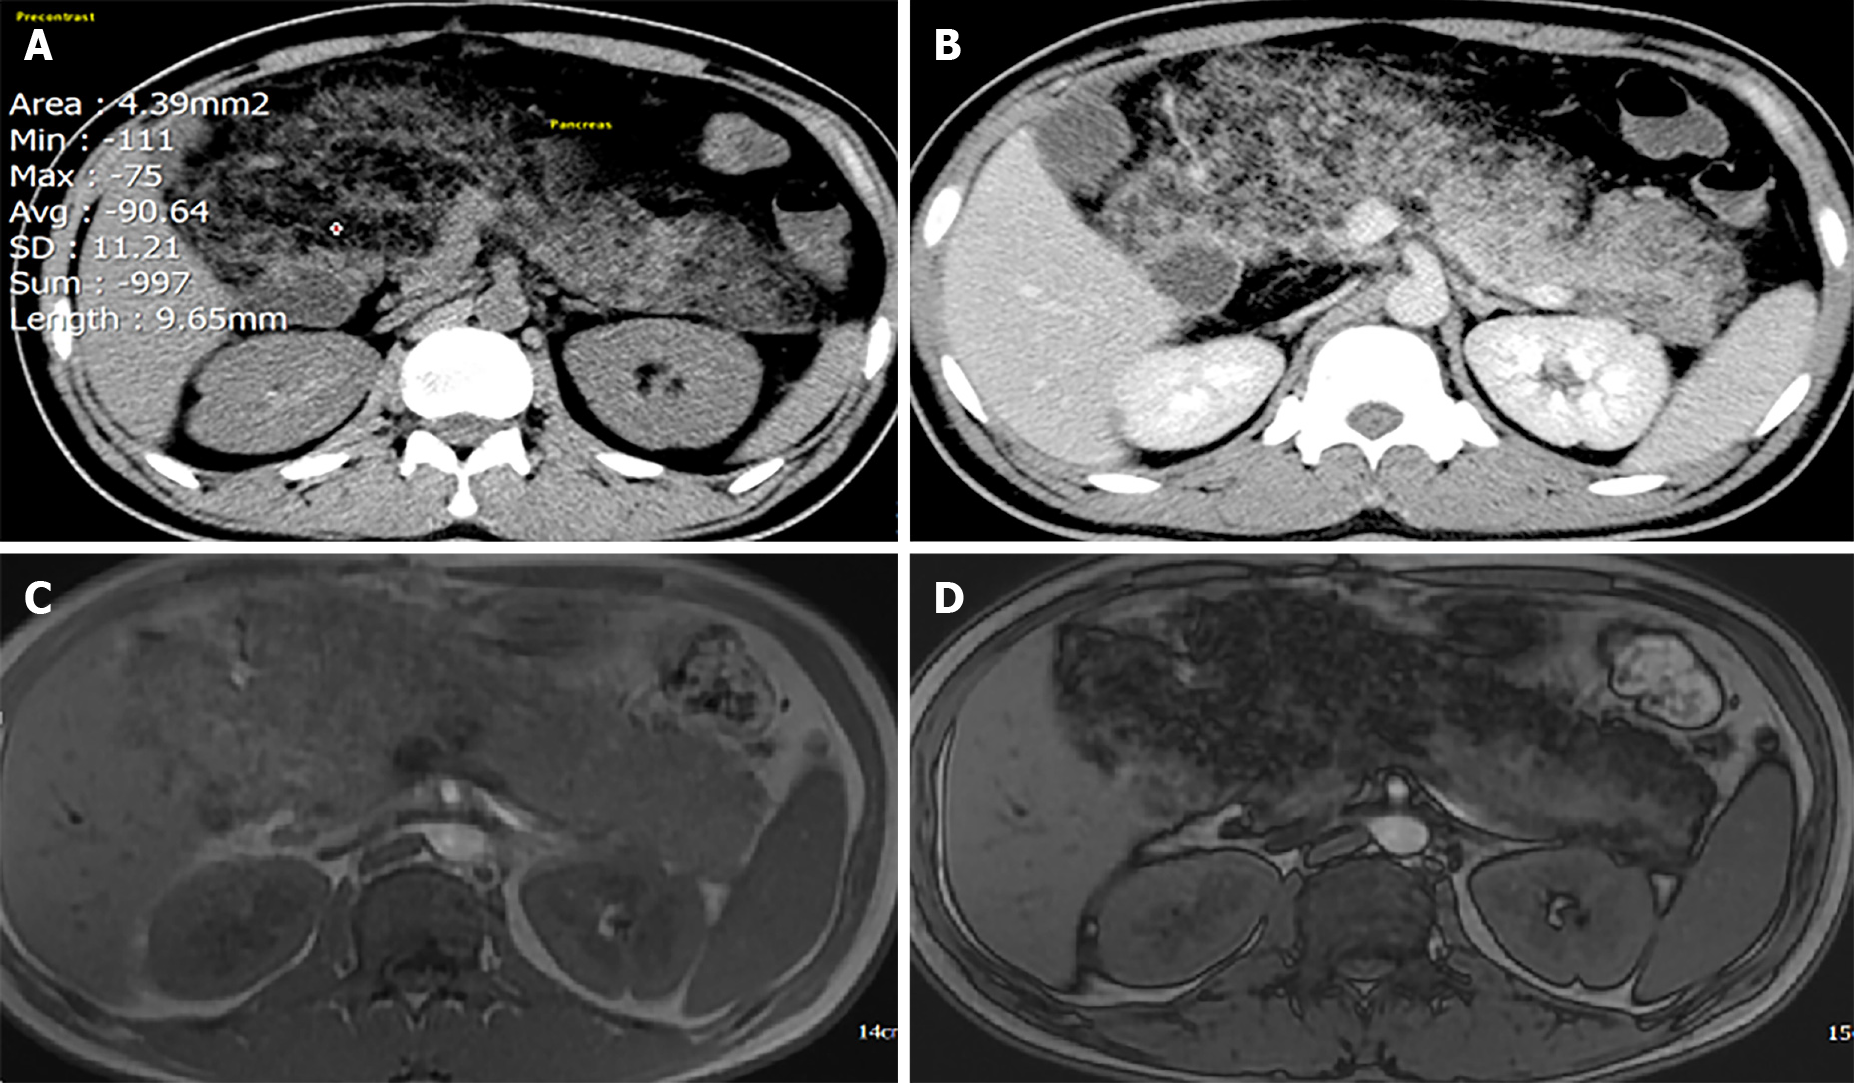
Figure 1 Computed tomography (CT) and magnetic resonance imaging (MRI).
A: Plain CT: density of the pancreatic parenchyma was uniformly decreased to the same level as that of the surrounding fatty tissue (attenuation value = 90.64 HU); B: Contrast-enhanced CT: Pancreatic parenchyma was absent, completely replaced by fat; C and D: MRI of the pancreas. In- and out-phase MRI respectively show a typical global (C) hyperintensity; and (D) fat suppression.
- Citation: Nguyen LC, Vu KT, Vo TTT, Trinh CH, Do TD, Pham NTV, Pham TV, Nguyen TT, Nguyen HC, Byeon JS. Brunner’s gland hyperplasia associated with lipomatous pseudohypertrophy of the pancreas presenting with gastrointestinal bleeding: A case report. World J Clin Cases 2021; 9(31): 9670-9679
- URL: https://www.wjgnet.com/2307-8960/full/v9/i31/9670.htm
- DOI: https://dx.doi.org/10.12998/wjcc.v9.i31.9670


