Copyright
©The Author(s) 2021.
World J Clin Cases. Nov 6, 2021; 9(31): 9652-9661
Published online Nov 6, 2021. doi: 10.12998/wjcc.v9.i31.9652
Published online Nov 6, 2021. doi: 10.12998/wjcc.v9.i31.9652
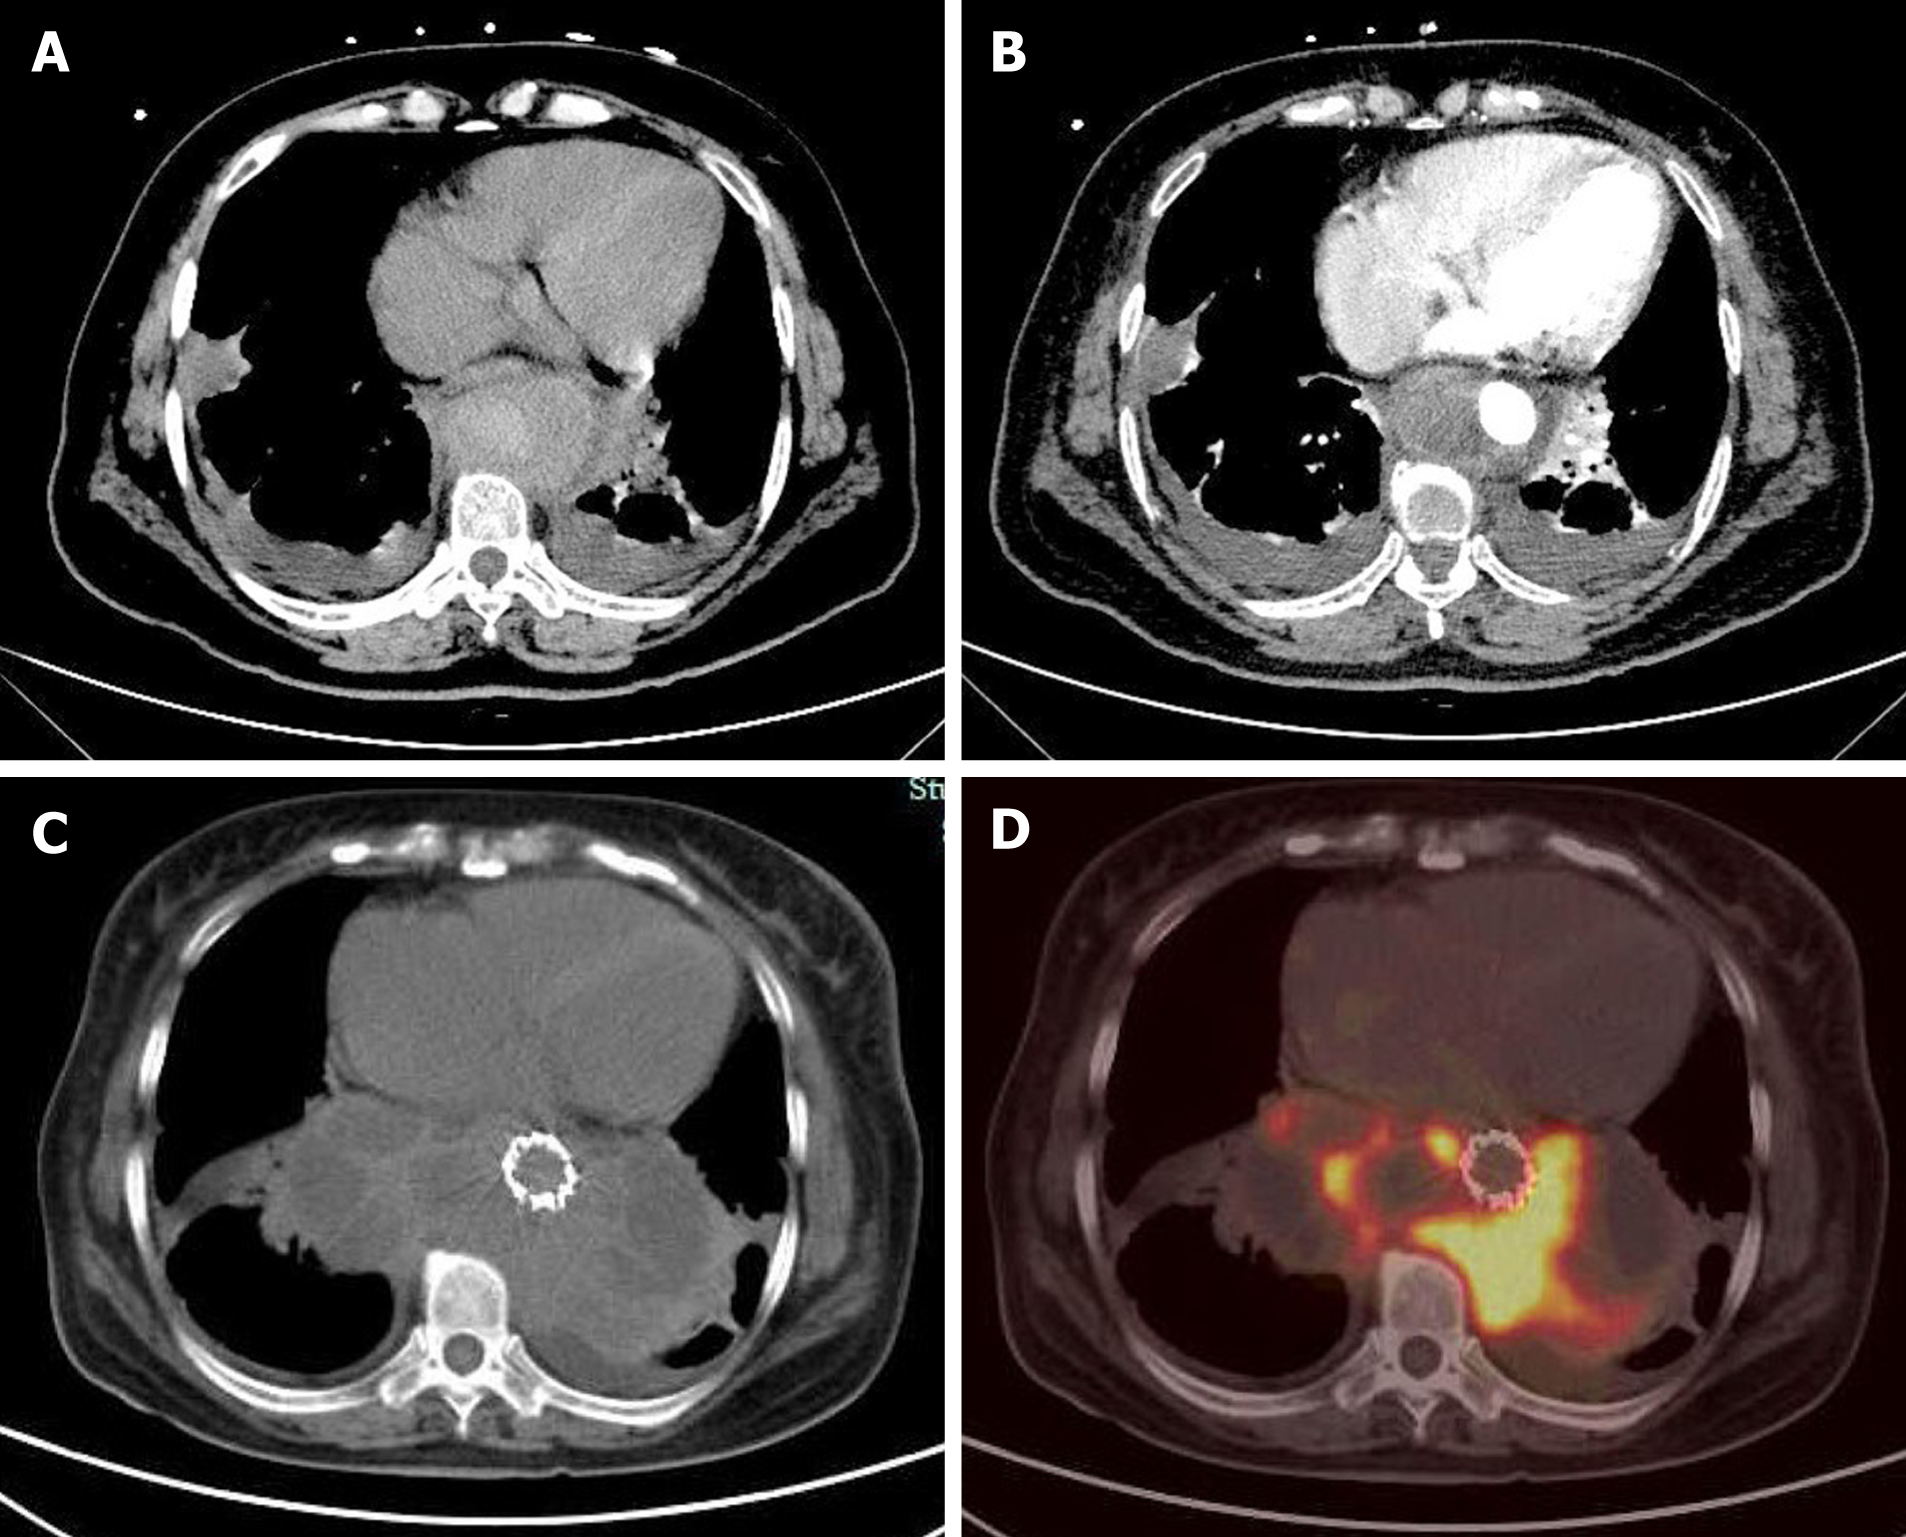
Figure 1 Computed tomography angiography and positron emission tomography/computed tomography transverse section images.
A: Computed tomography (CT) scan; B: Contrast-enhanced CT scan at approximately the same anatomic level. A circular mass with a patchy high-density enhanced signal was found around the lower thoracic aorta. The mass showed heterogeneous enhancement on the contrast-enhanced CT scan; C: CT scan 1 mo later; D: Positron emission tomography scan at the same anatomic level 1 mo later. The mass had significantly increased, still surrounding the lower thoracic aorta. The high-density part of the mass had increased fluorodeoxyglucose (FDG) metabolism, whereas the low-density part had decreased FDG metabolism.
- Citation: Xie XJ, Jiang TA, Zhao QY. Diagnostic value of contrast-enhanced ultrasonography in mediastinal leiomyosarcoma mimicking aortic hematoma: A case report and review of literature . World J Clin Cases 2021; 9(31): 9652-9661
- URL: https://www.wjgnet.com/2307-8960/full/v9/i31/9652.htm
- DOI: https://dx.doi.org/10.12998/wjcc.v9.i31.9652


