Copyright
©The Author(s) 2021.
World J Clin Cases. Oct 16, 2021; 9(29): 8671-8693
Published online Oct 16, 2021. doi: 10.12998/wjcc.v9.i29.8671
Published online Oct 16, 2021. doi: 10.12998/wjcc.v9.i29.8671
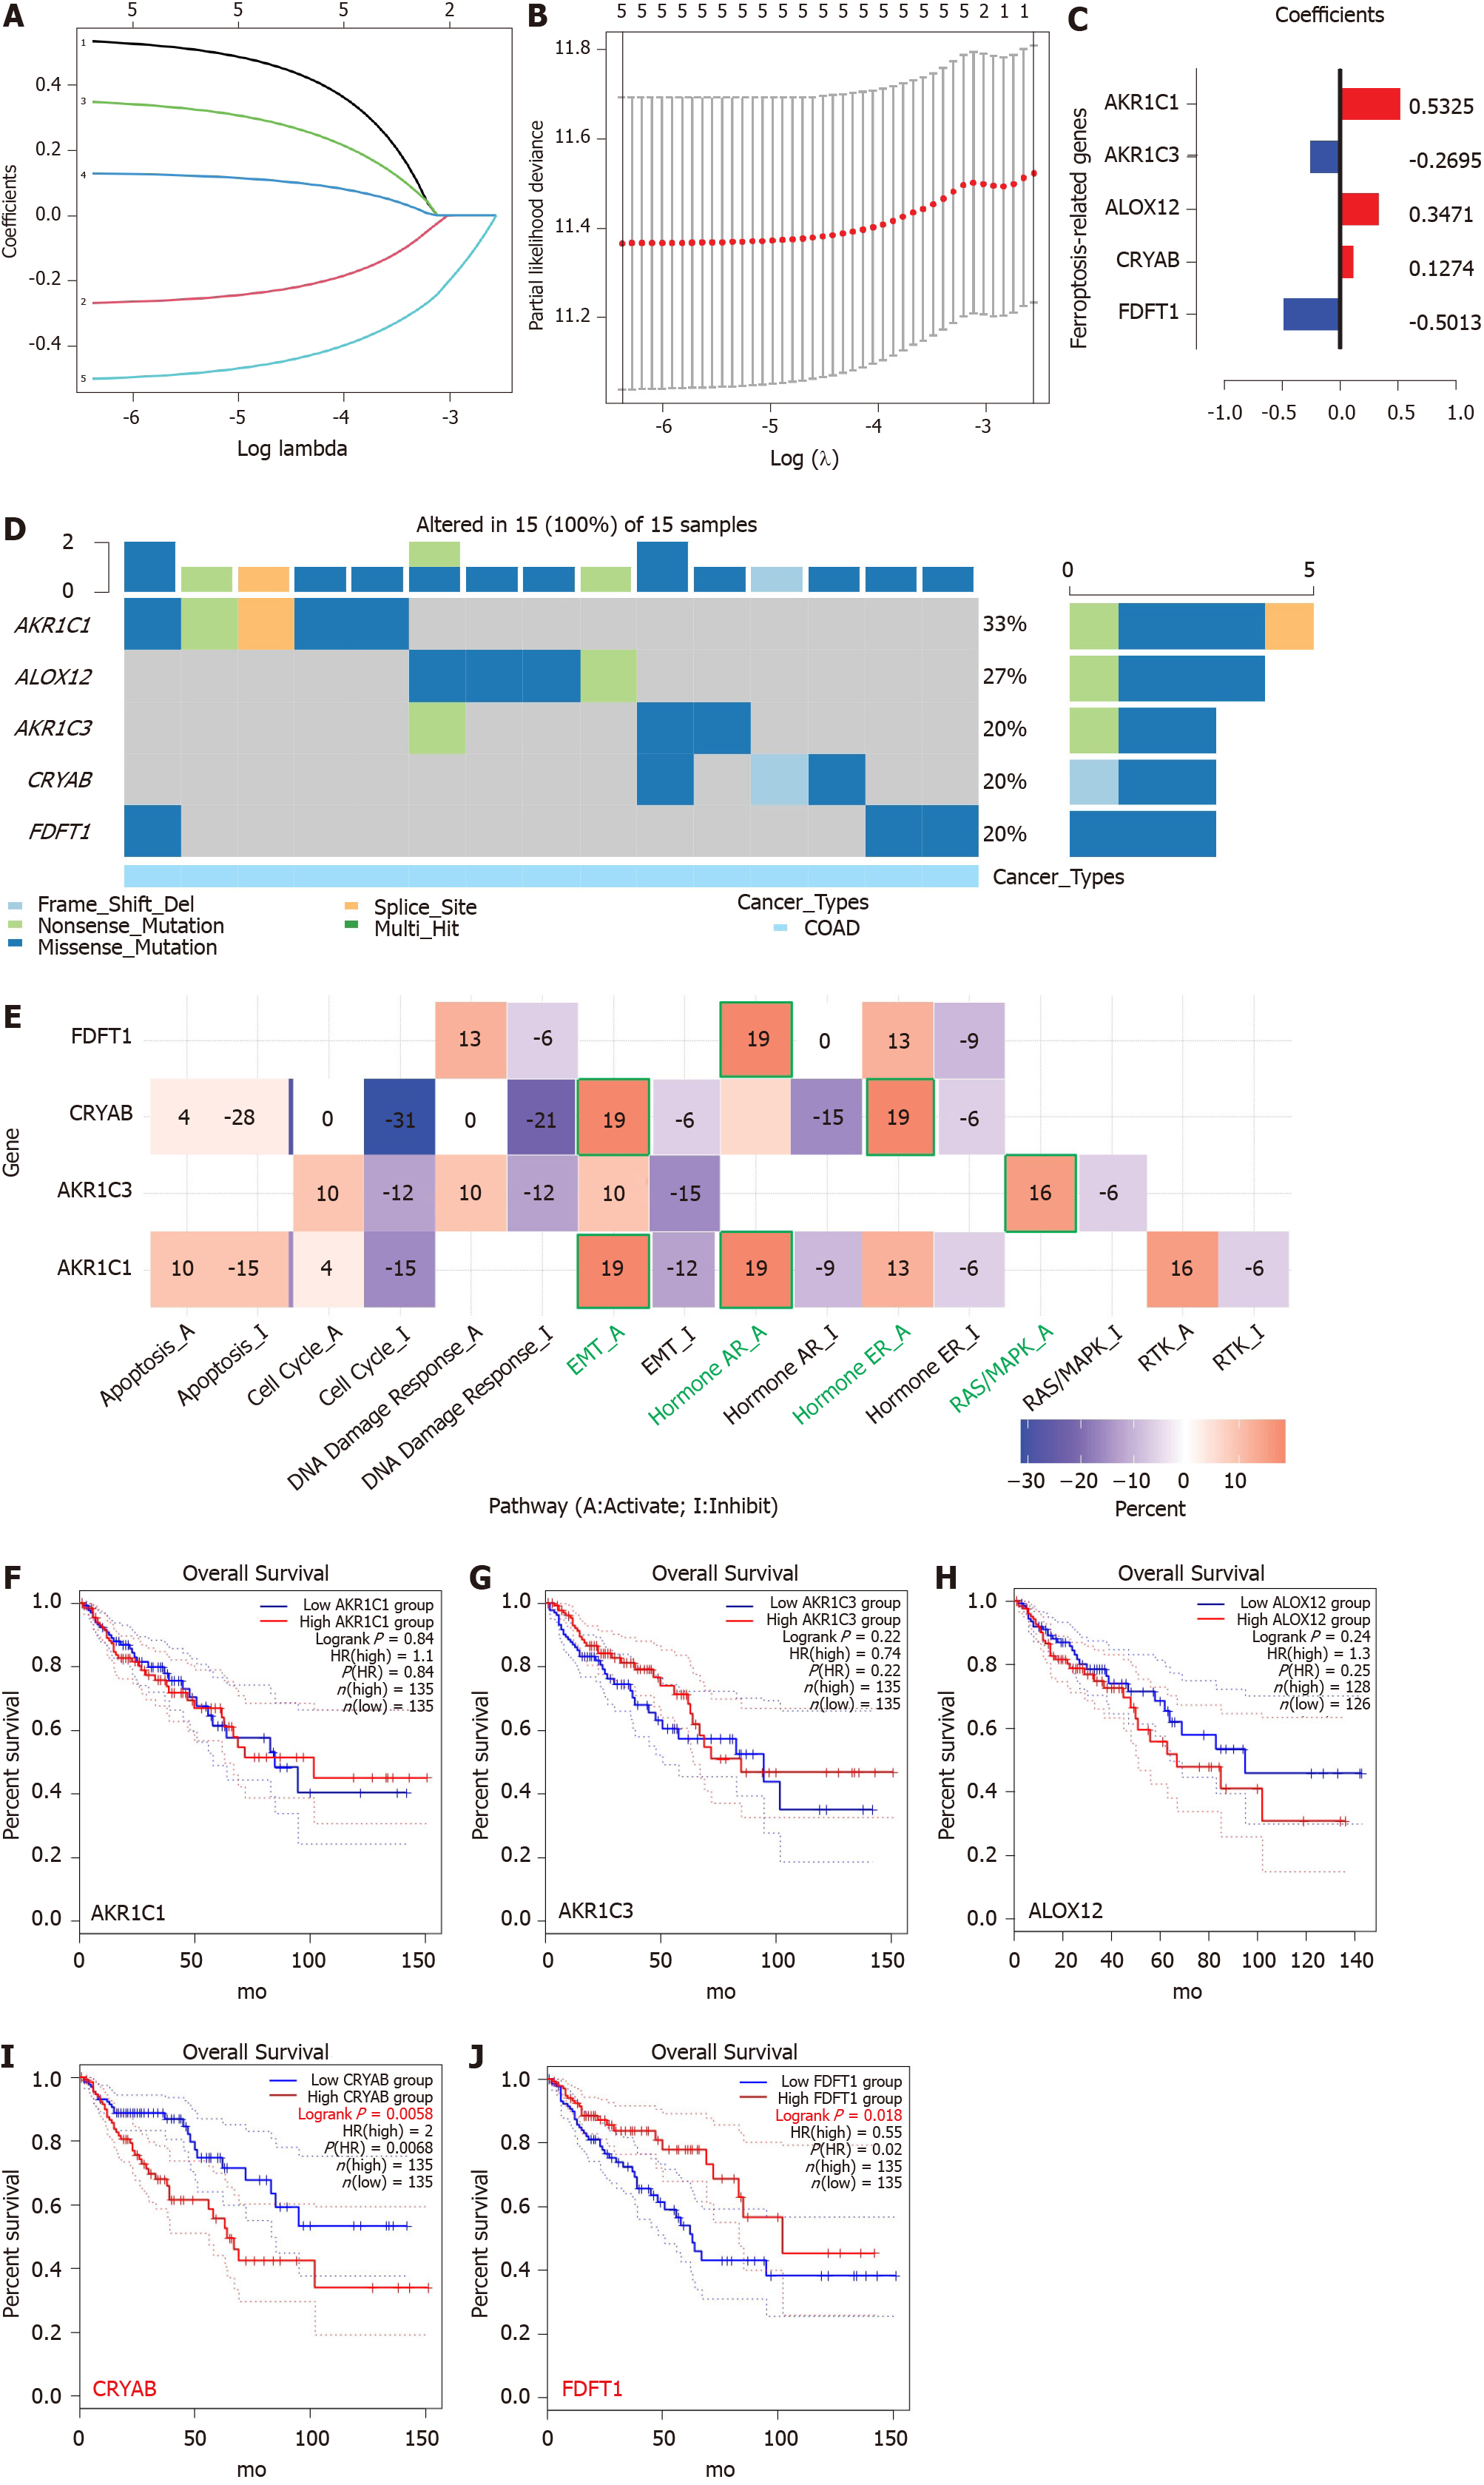
Figure 3 Establishment of a prognostic ferroptosis-related gene signature by least absolute shrinkage and selection operator Cox regression analysis.
A-C: Process of constructing the signature including five ferroptosis-related genes. A coefficient profile plot (C) was generated against the log (lambda) sequence (A); B: Selection of the optimal parameter (lambda) in the least absolute shrinkage and selection operator model for colon adenocarcinoma; D: Genetic alteration of the five genes in colon adenocarcinoma using Gene Set Cancer Analysis. The X axis represents the cancer type, and sky blue indicates colon adenocarcinoma. The left Y axis represents the ratio of gene mutations, and the right Y axis represents the gene names. Different-colored small rectangles indicate the type of gene mutation; E: Four ferroptosis-related genes involved in the regulation of signaling pathways using Gene Set Cancer Analysis. The green pathway names indicate the pathway with the highest proportion of regulation of each gene; F: Single-gene survival analysis of the five ferroptosis-related genes based on the web database GEPIA2. COAD: Colon adenocarcinoma; EMT: Epithelial-mesenchymal transition; AR: Androgen receptor; ER: Estrogen receptor.
- Citation: Miao YD, Kou ZY, Wang JT, Mi DH. Prognostic implications of ferroptosis-associated gene signature in colon adenocarcinoma. World J Clin Cases 2021; 9(29): 8671-8693
- URL: https://www.wjgnet.com/2307-8960/full/v9/i29/8671.htm
- DOI: https://dx.doi.org/10.12998/wjcc.v9.i29.8671


