Copyright
©The Author(s) 2021.
World J Clin Cases. Oct 16, 2021; 9(29): 8671-8693
Published online Oct 16, 2021. doi: 10.12998/wjcc.v9.i29.8671
Published online Oct 16, 2021. doi: 10.12998/wjcc.v9.i29.8671
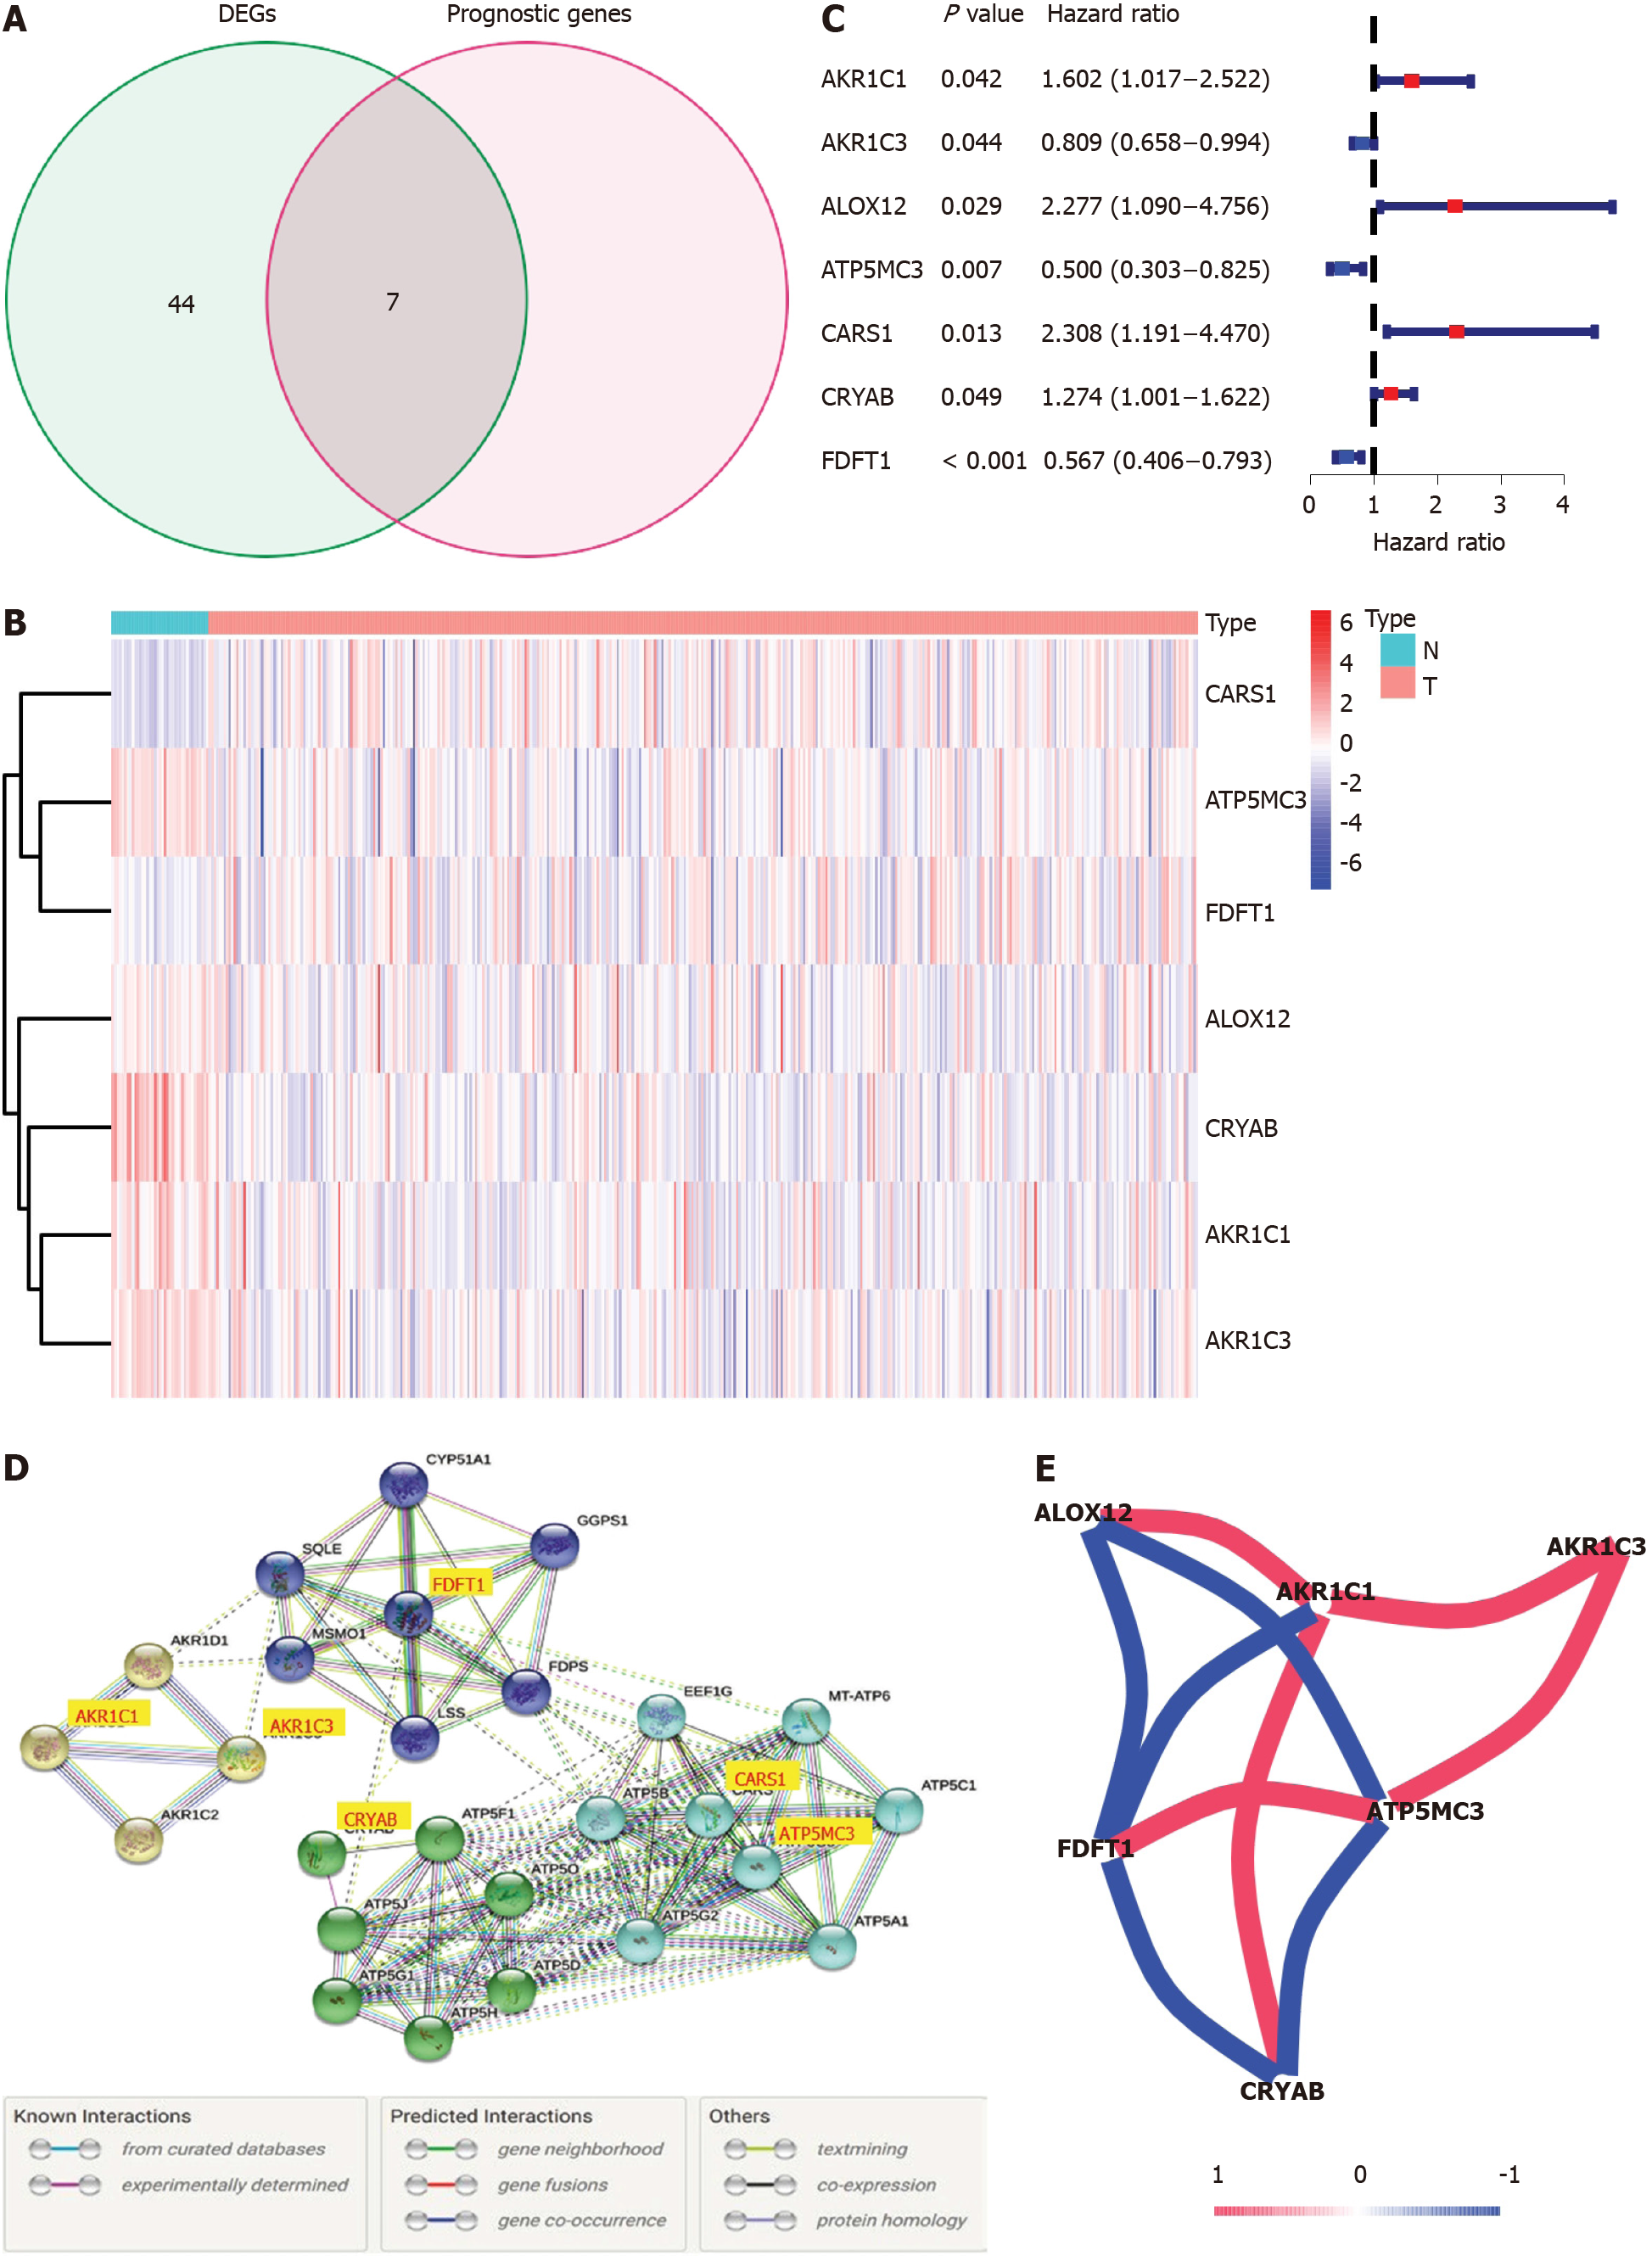
Figure 2 Identification of the candidate prognostic ferroptosis-related genes in the Cancer Genome Atlas-colon adenocarcinoma cohort.
A: Venn diagram to confirm differentially expressed genes between corresponding adjacent normal tissue and tumor tissue related to overall survival; B: Heatmap of the seven prognostic ferroptosis-related gene expression profiles in the Cancer Genome Atlas-colon adenocarcinoma cohort; C: Forest plots demonstrated the results of the univariate Cox regression analysis between the expression of the seven prognostic ferroptosis-related genes and overall survival; D: PPI network obtained from the STRING database indicated the interactions among the candidate genes; E: Correlation network of candidate genes. The correlation coefficients are shown using different colors. DEGs: Differentially expressed genes.
- Citation: Miao YD, Kou ZY, Wang JT, Mi DH. Prognostic implications of ferroptosis-associated gene signature in colon adenocarcinoma. World J Clin Cases 2021; 9(29): 8671-8693
- URL: https://www.wjgnet.com/2307-8960/full/v9/i29/8671.htm
- DOI: https://dx.doi.org/10.12998/wjcc.v9.i29.8671


