Copyright
©The Author(s) 2021.
World J Clin Cases. Oct 6, 2021; 9(28): 8388-8403
Published online Oct 6, 2021. doi: 10.12998/wjcc.v9.i28.8388
Published online Oct 6, 2021. doi: 10.12998/wjcc.v9.i28.8388
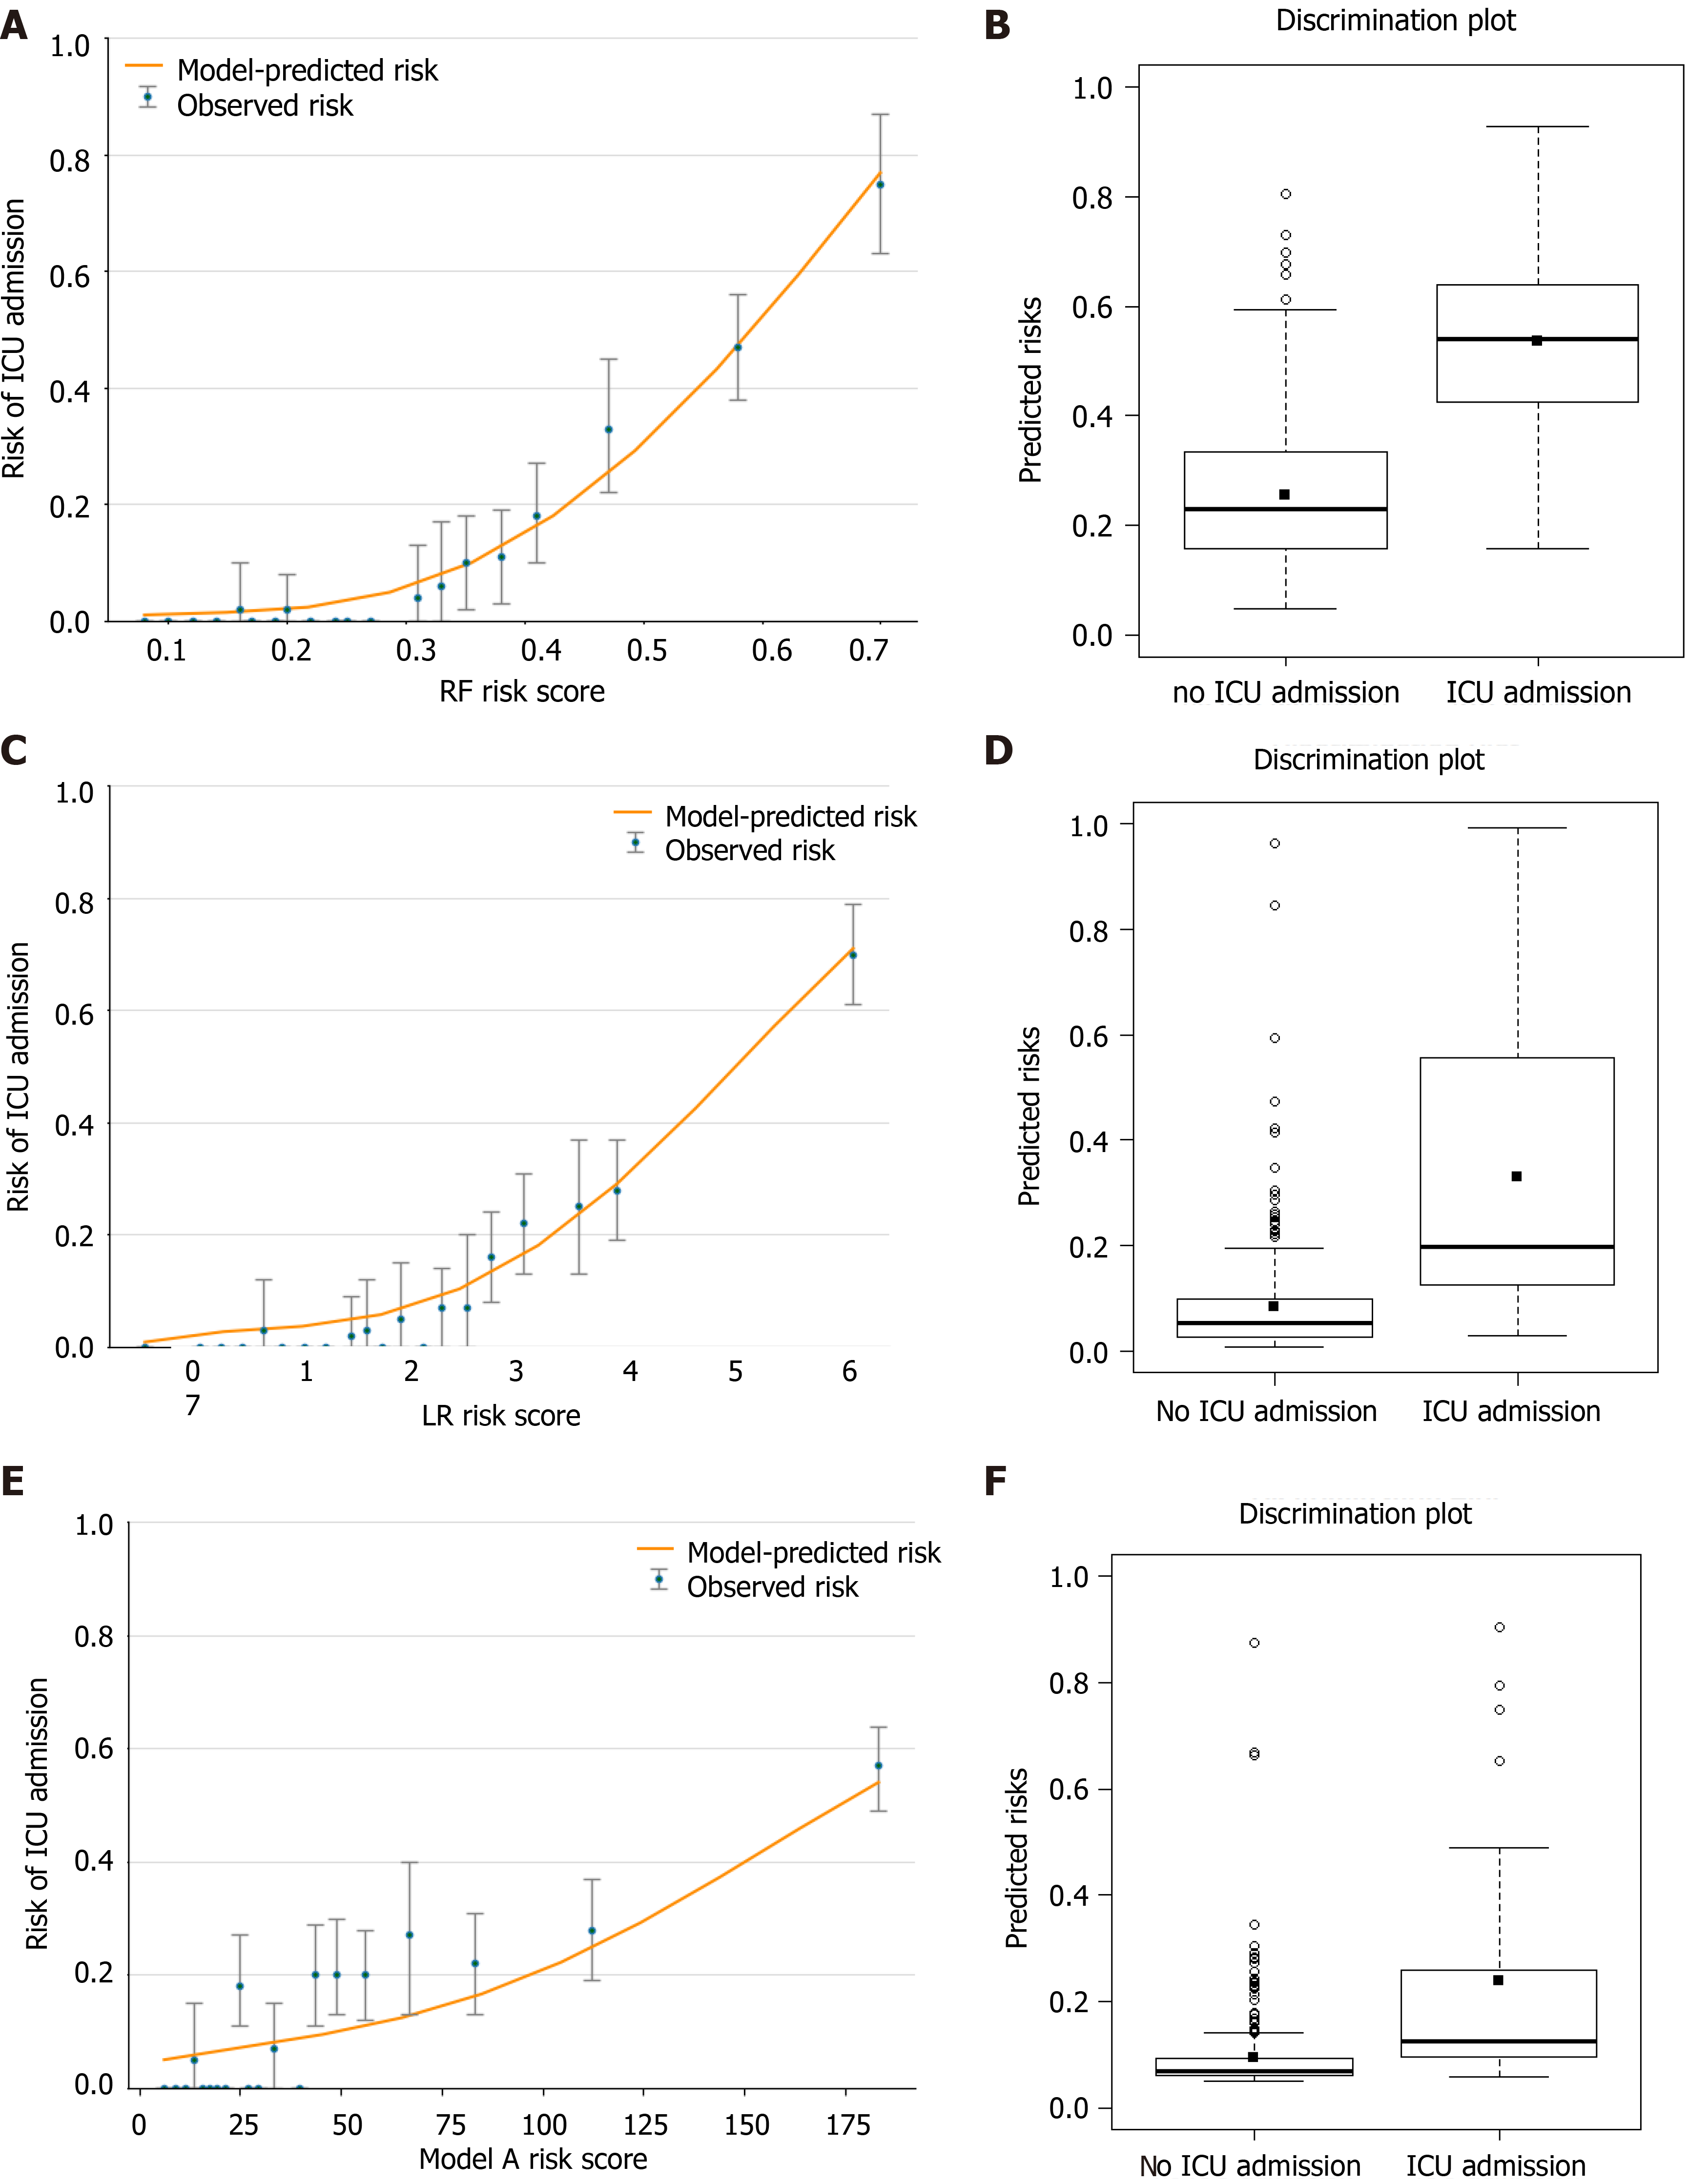
Figure 8 The calibration and discrimination of model random forest, logistic regression and A in external validation dataset.
A, C and E: The graph represents the relationship between observed (data markers represent the mean and the error bars represent the 95% confidence interval) and predicted risk of intensive care unit (ICU) admission using the models (orange line); B, D and F: The discrimination potentials of the random forest (RF), logistic regression (LR) and model A models. The values of the discrimination slope were 0.281, 0.246 and 0.143, respectively.
- Citation: Huang HF, Liu Y, Li JX, Dong H, Gao S, Huang ZY, Fu SZ, Yang LY, Lu HZ, Xia LY, Cao S, Gao Y, Yu XX. Validated tool for early prediction of intensive care unit admission in COVID-19 patients. World J Clin Cases 2021; 9(28): 8388-8403
- URL: https://www.wjgnet.com/2307-8960/full/v9/i28/8388.htm
- DOI: https://dx.doi.org/10.12998/wjcc.v9.i28.8388


