Copyright
©The Author(s) 2021.
World J Clin Cases. Aug 16, 2021; 9(23): 6846-6857
Published online Aug 16, 2021. doi: 10.12998/wjcc.v9.i23.6846
Published online Aug 16, 2021. doi: 10.12998/wjcc.v9.i23.6846
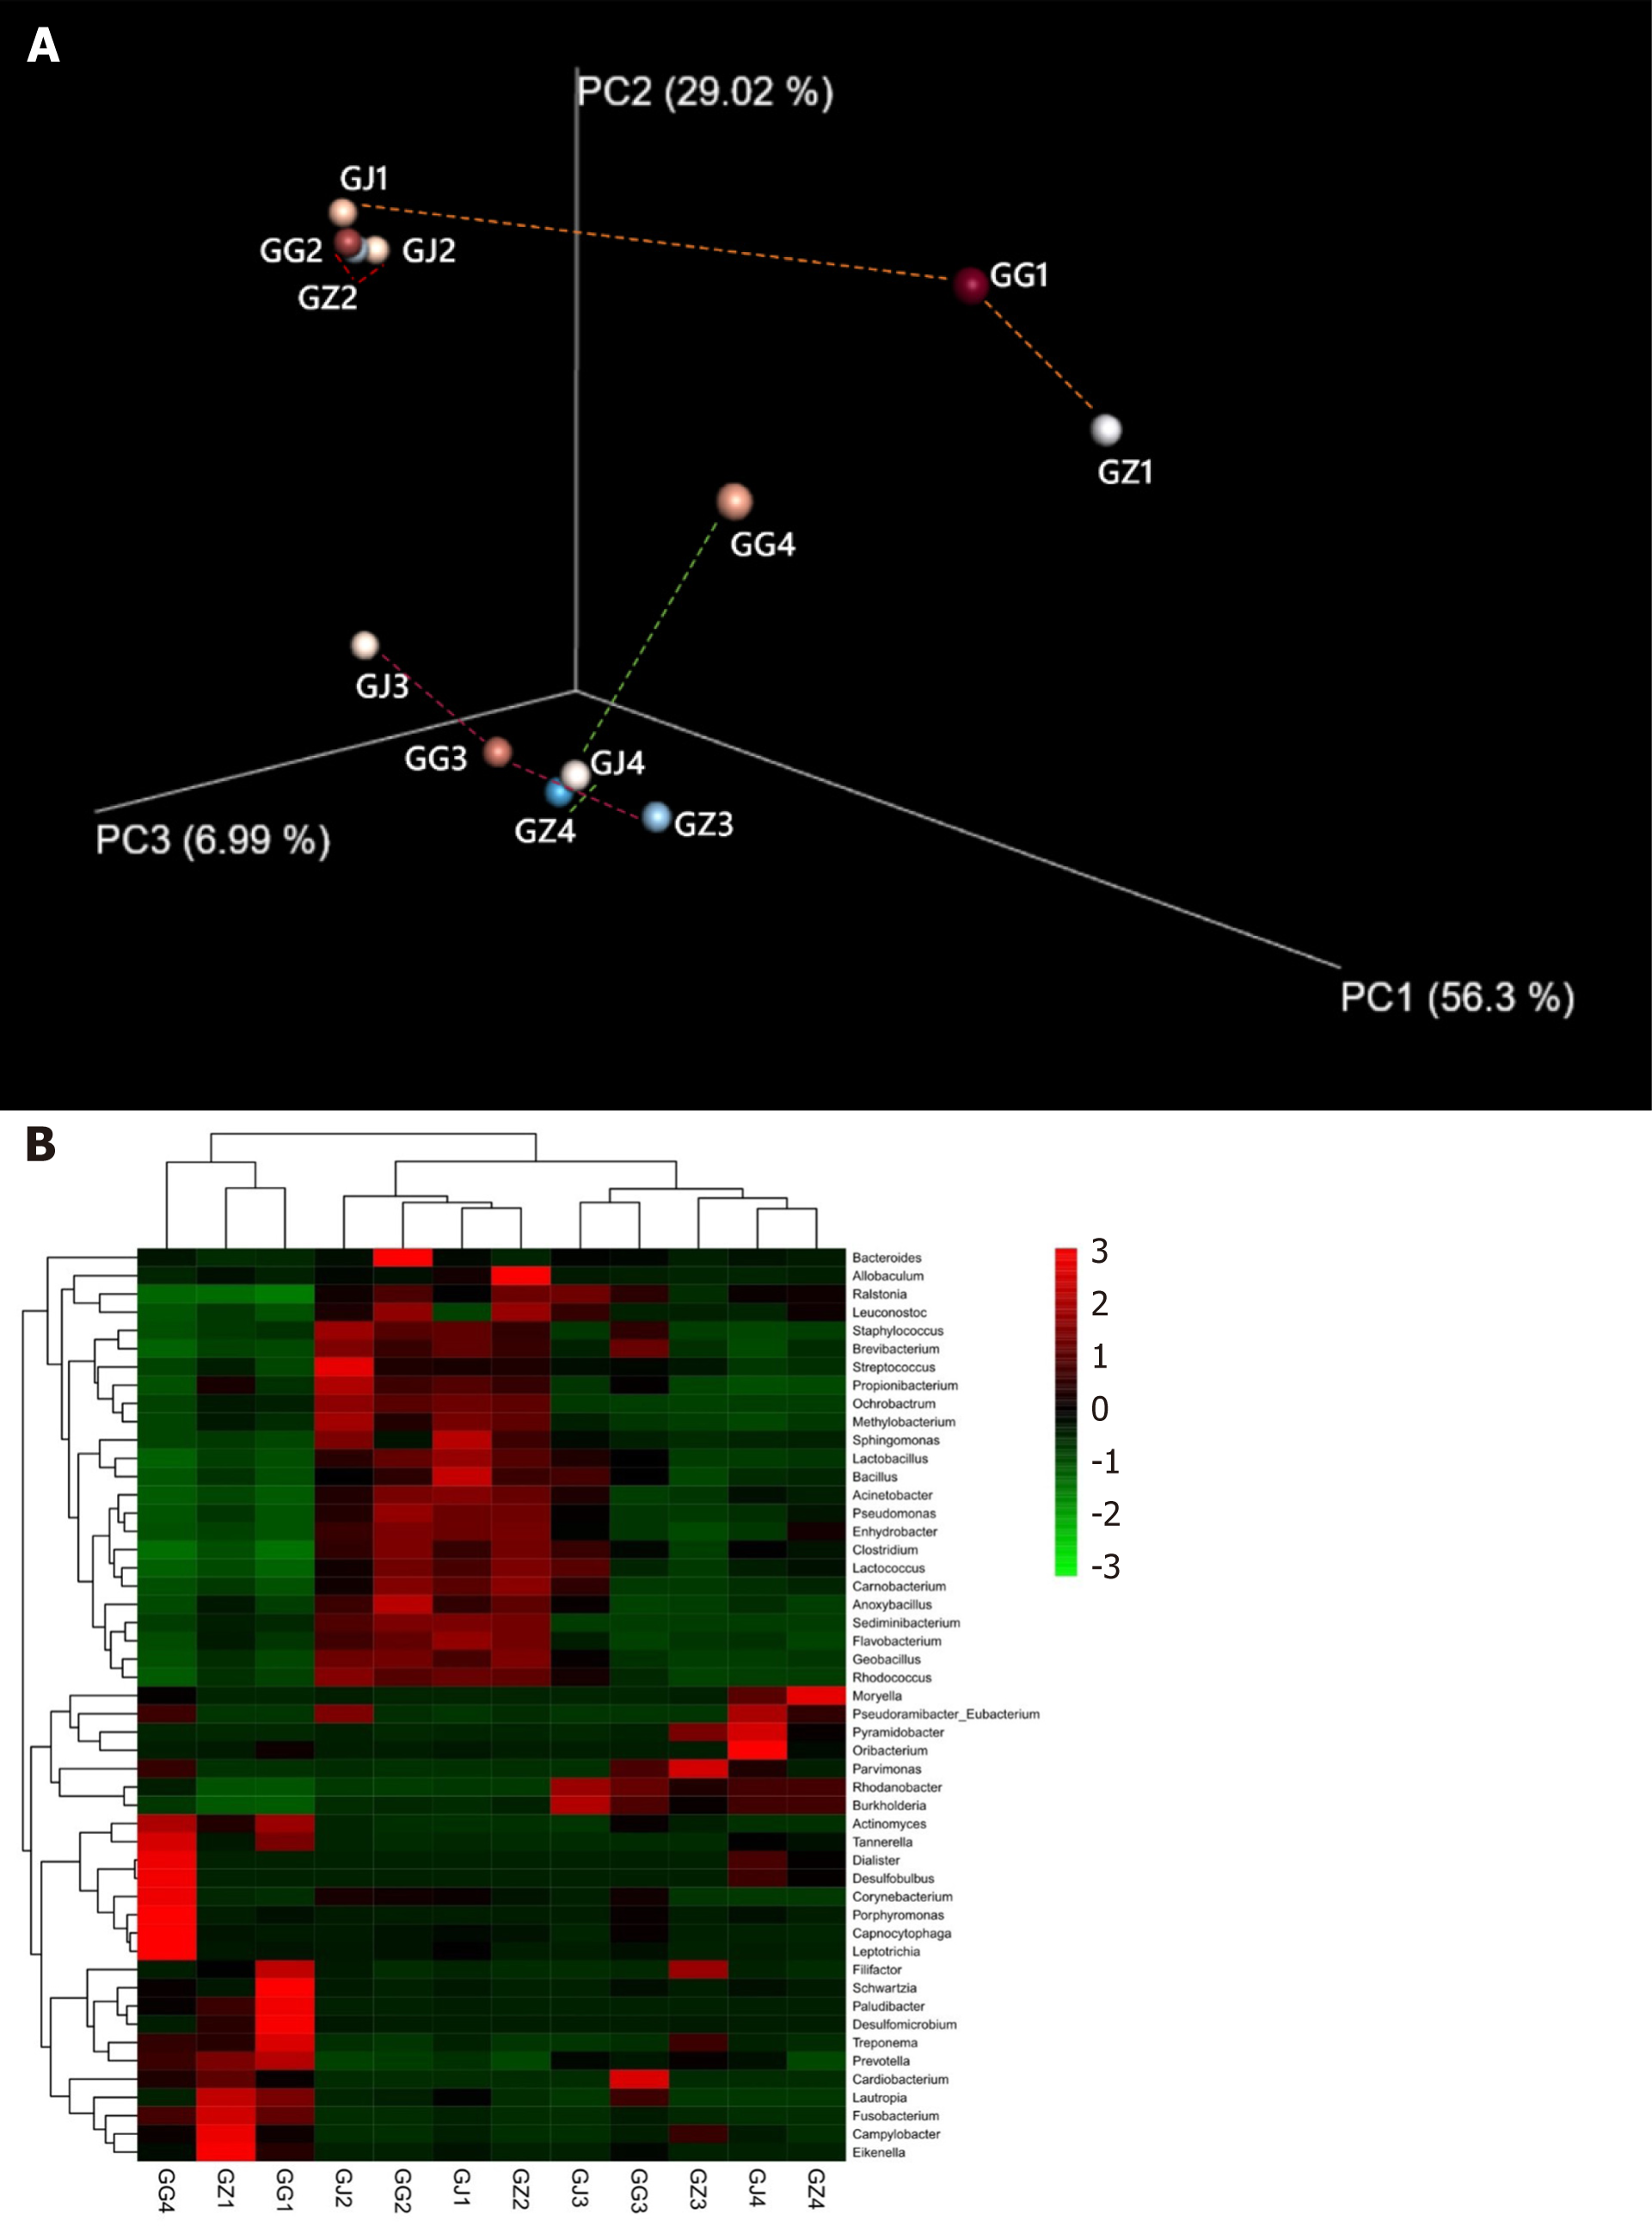
Figure 4 Bacterial community structures.
A: Principal coordinates analysis plot of the phylogenetic distances (Weighted UniFrac) among the segments from 4 infected roots with palatal grooves. Principal coordinates PC1, PC2, and PC3 explained 56.30%, 29.02%, and 6.99% of the overall variance among the samples, respectively. Segments (GJ, GZ, and GG) from the same root (labeled with the same number) are connected with dashed lines. Segment groups differ in their phylogenetic relatedness from being very adjacent or similar (root 2 and 3) to very distant or phylogenetically different (GJ1 and GG4 from root 1 and 4, respectively); B: Cluster and comparison of the samples at the genus level using a gradient heat map (microbiota with the top 50 abundance). GJ: Apical samples; GZ: Middle samples; GG: Cervical samples.
- Citation: Tan XL, Chen X, Fu YJ, Ye L, Zhang L, Huang DM. Diverse microbiota in palatal radicular groove analyzed by Illumina sequencing: Four case reports. World J Clin Cases 2021; 9(23): 6846-6857
- URL: https://www.wjgnet.com/2307-8960/full/v9/i23/6846.htm
- DOI: https://dx.doi.org/10.12998/wjcc.v9.i23.6846


