Copyright
©The Author(s) 2021.
World J Clin Cases. Jul 26, 2021; 9(21): 6009-6016
Published online Jul 26, 2021. doi: 10.12998/wjcc.v9.i21.6009
Published online Jul 26, 2021. doi: 10.12998/wjcc.v9.i21.6009
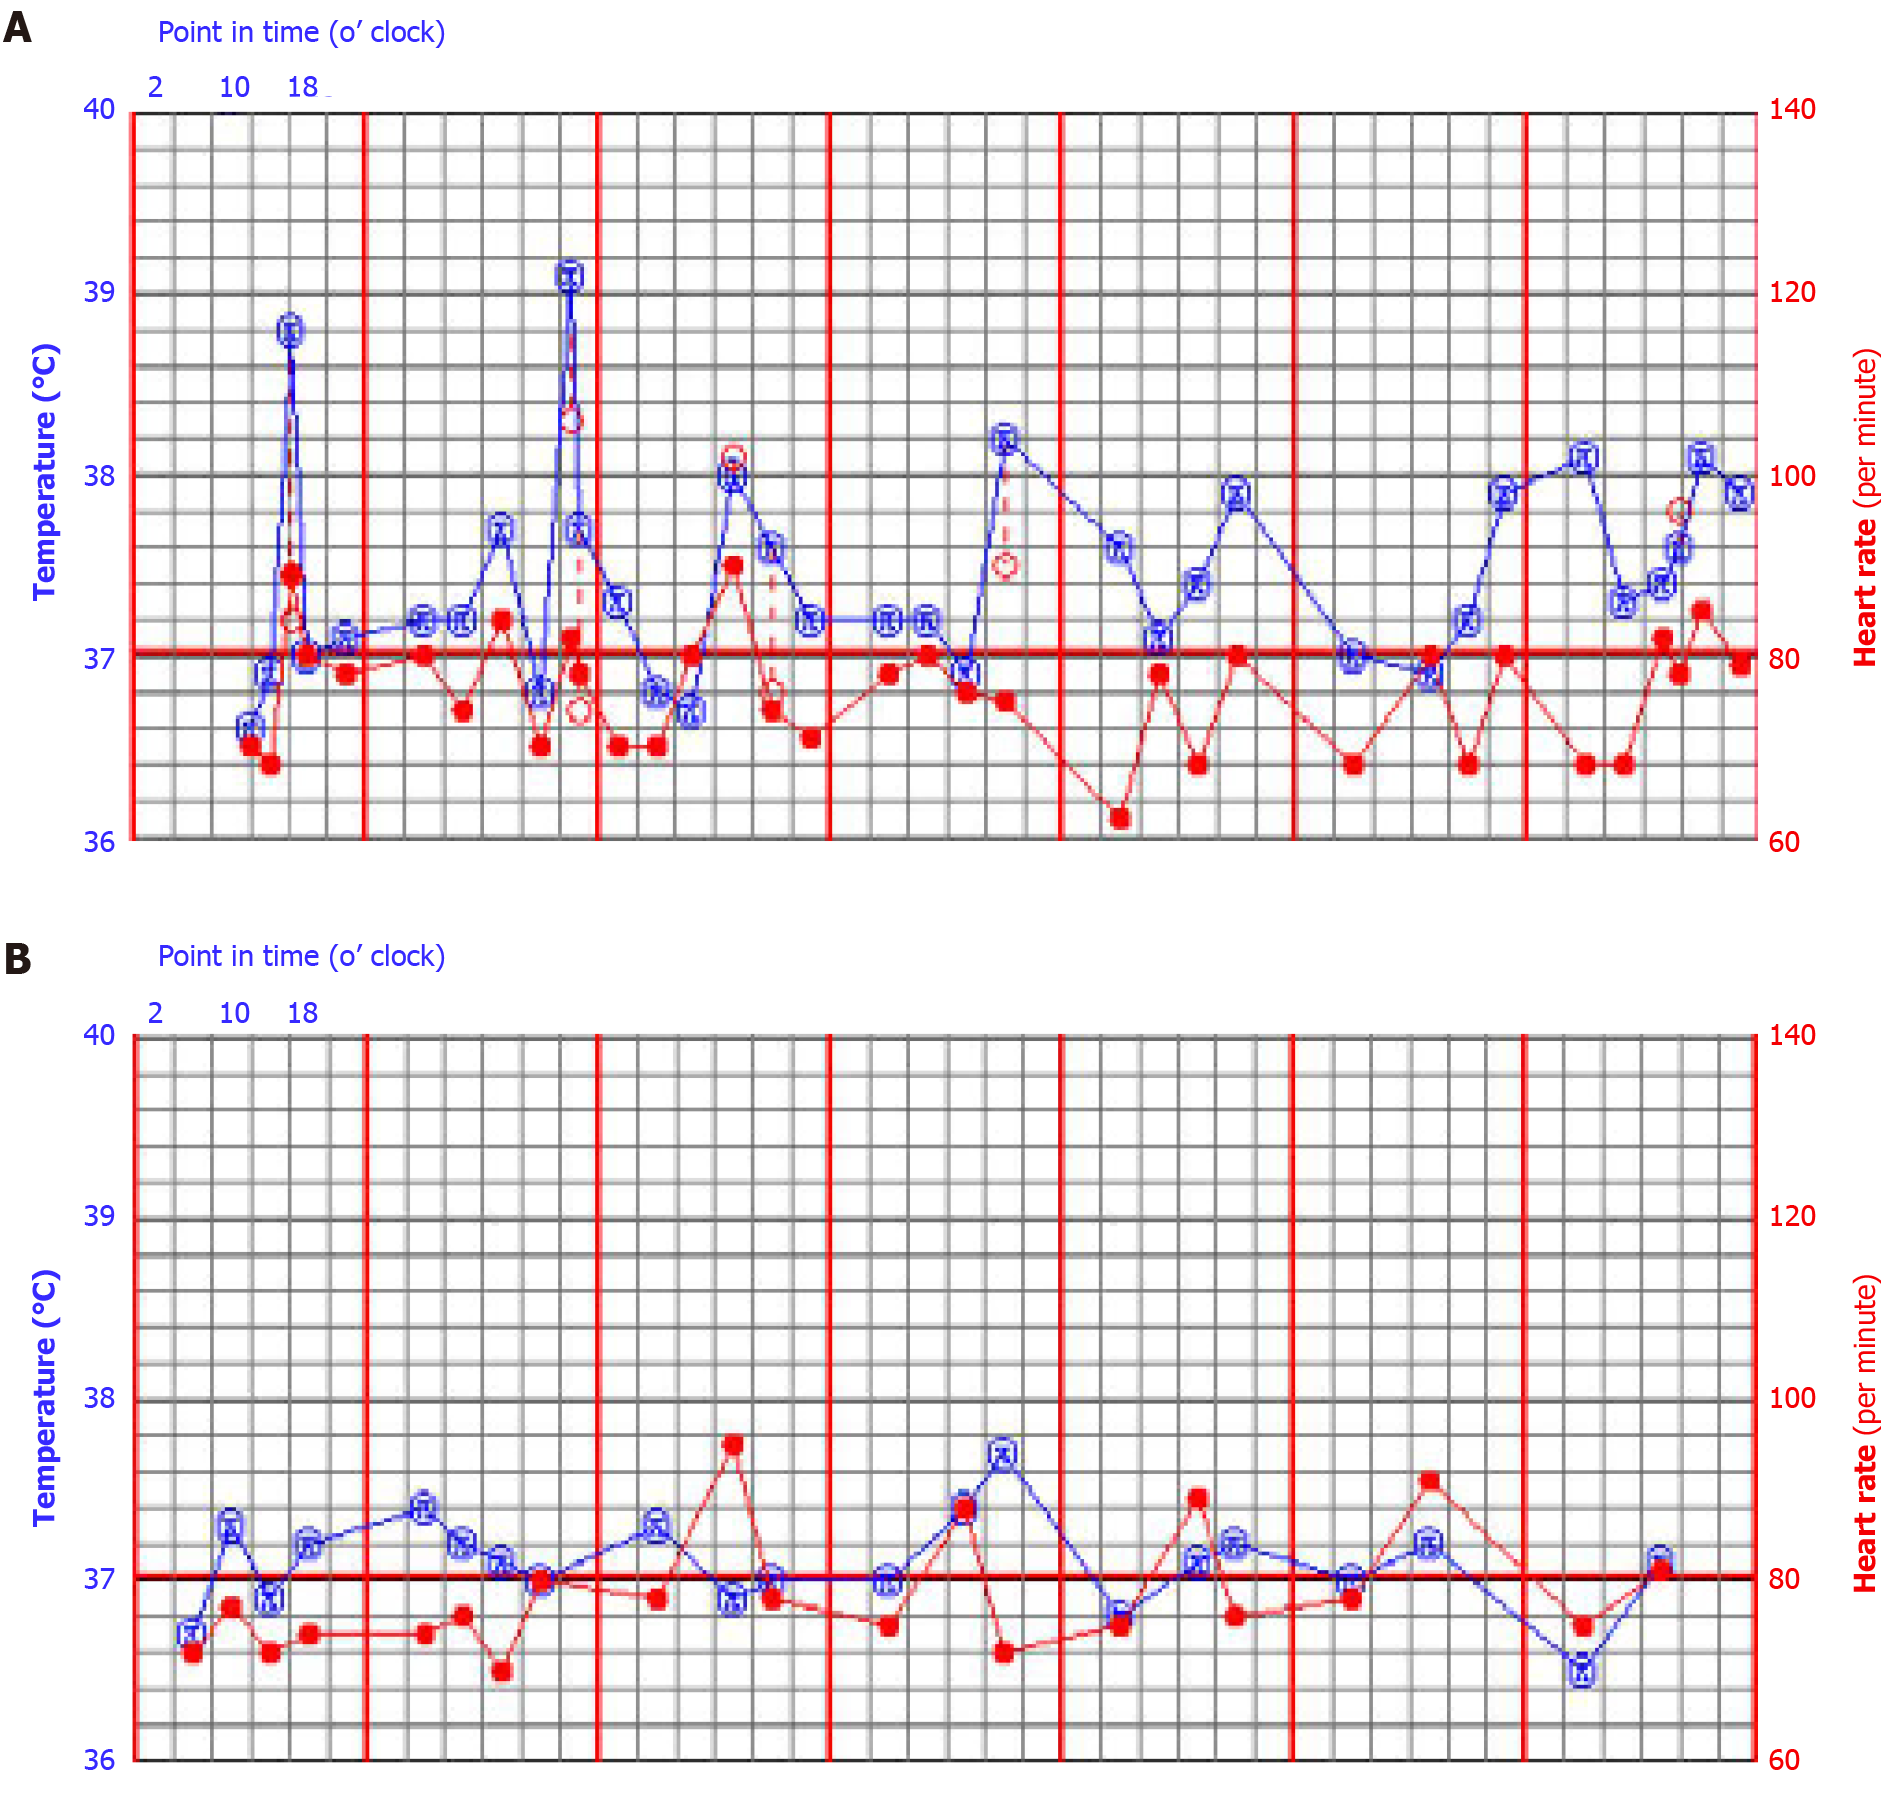
Figure 3 Curve of temperature changes.
The blue line indicates body temperature, and the red line indicates heart rate. A: One week before treatment for Brucella, the body temperature increased continuously, mainly between the afternoon and the middle of the night; B: One week after starting treatment, the temperature gradually returned to normal.
- Citation: Yan JF, Zhou HY, Luo SF, Wang X, Yu JD. Rare case of brucellosis misdiagnosed as prostate carcinoma with lumbar vertebra metastasis: A case report. World J Clin Cases 2021; 9(21): 6009-6016
- URL: https://www.wjgnet.com/2307-8960/full/v9/i21/6009.htm
- DOI: https://dx.doi.org/10.12998/wjcc.v9.i21.6009


