Copyright
©The Author(s) 2021.
World J Clin Cases. Jul 6, 2021; 9(19): 5019-5027
Published online Jul 6, 2021. doi: 10.12998/wjcc.v9.i19.5019
Published online Jul 6, 2021. doi: 10.12998/wjcc.v9.i19.5019
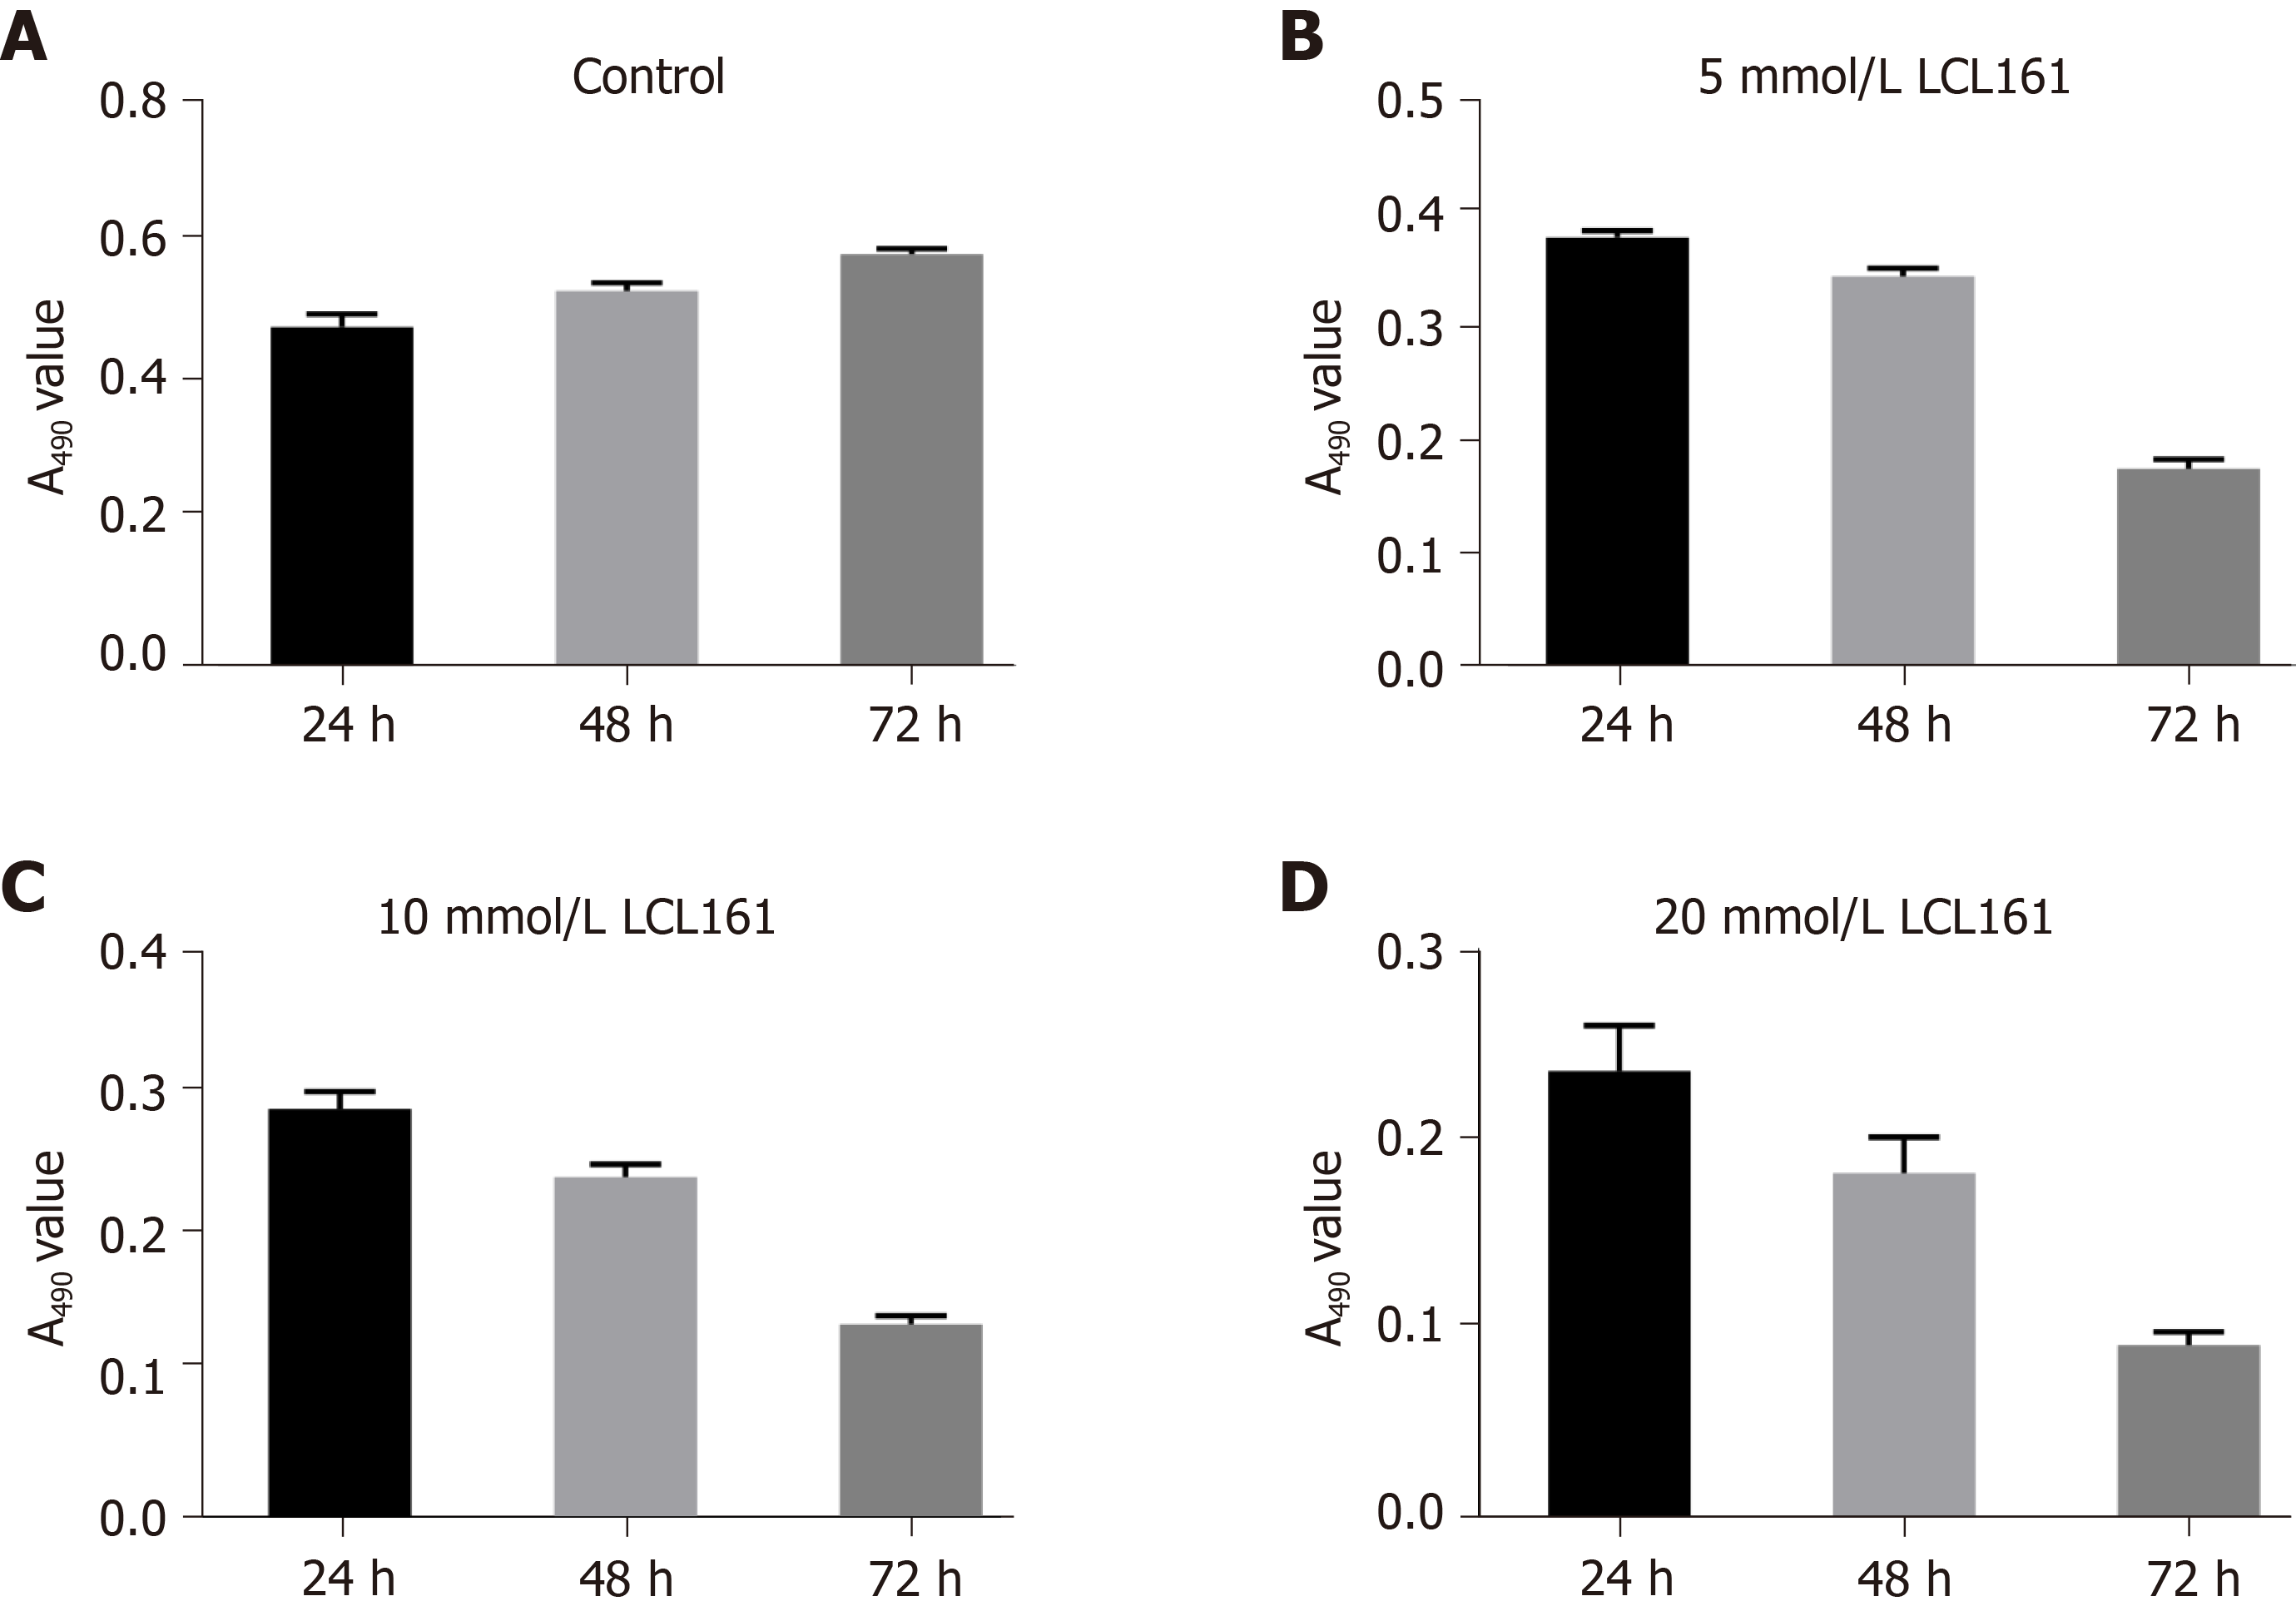
Figure 2 Proliferation of ECA109 cells in the control group and treatment groups with different concentration of LCL161.
Proliferation of ECA109 cells decreased in the 5 mmol/L, 10 mmol/L, and 20 mmol/L groups compared to the control group (P < 0.05) at different time points (24 h, 48 h, and 72 h). A: Control group; B: 5 mmol/L LCL161 treatment group; C: 10 mmol/L LCL161 treatment group; D: 20 mmol/L LCL161 treatment group.
- Citation: Jiang N, Zhang WQ, Dong H, Hao YT, Zhang LM, Shan L, Yang XD, Peng CL. SMAC exhibits anti-tumor effects in ECA109 cells by regulating expression of inhibitor of apoptosis protein family. World J Clin Cases 2021; 9(19): 5019-5027
- URL: https://www.wjgnet.com/2307-8960/full/v9/i19/5019.htm
- DOI: https://dx.doi.org/10.12998/wjcc.v9.i19.5019


