Copyright
©The Author(s) 2021.
World J Clin Cases. Jun 16, 2021; 9(17): 4285-4293
Published online Jun 16, 2021. doi: 10.12998/wjcc.v9.i17.4285
Published online Jun 16, 2021. doi: 10.12998/wjcc.v9.i17.4285
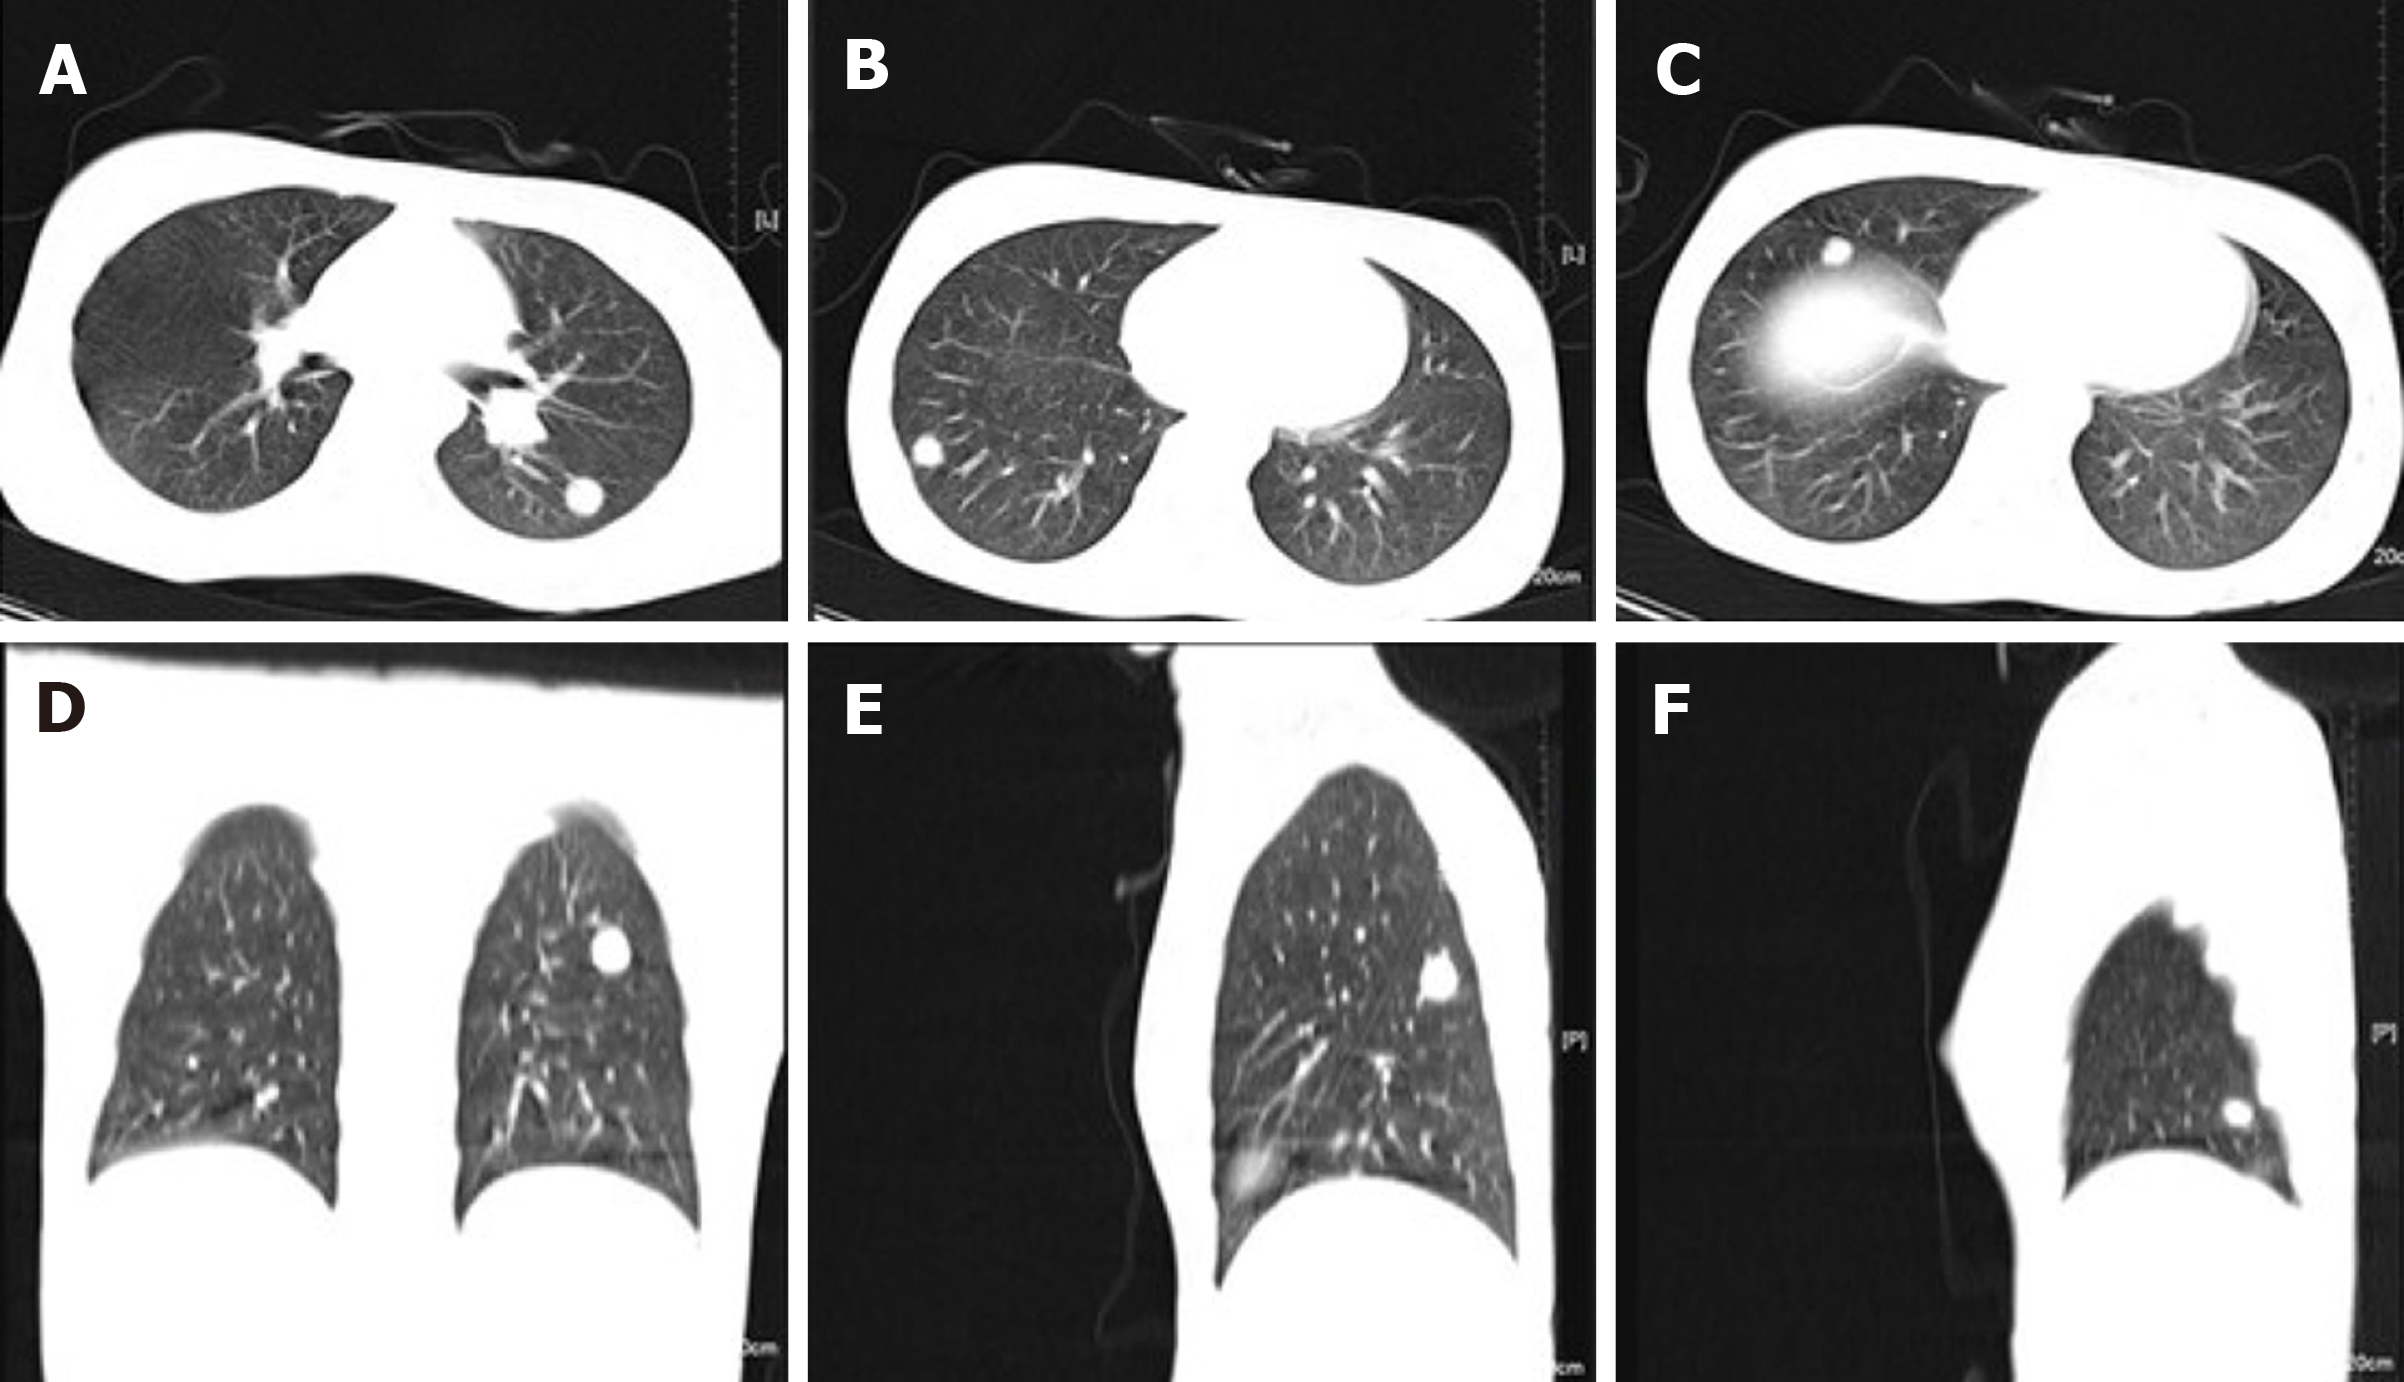
Figure 4 Computed tomography of the lungs.
A: The largest nodule was located in the upper segment of the left lower lung with a diameter of approximately 1.2 cm; A, D, and E: There were different size of nodules in the left lung; B, C, and F: There were multiple nodules of different sizes scattered in the right lung; A-F: All nodules had clear boundaries and uniform internal density, with an average computed tomography value of about 60 HU.
- Citation: Wu GJ, Li BB, Zhu RL, Yang CJ, Chen WY. Rosai-Dorfman disease with lung involvement in a 10-year-old patient: A case report. World J Clin Cases 2021; 9(17): 4285-4293
- URL: https://www.wjgnet.com/2307-8960/full/v9/i17/4285.htm
- DOI: https://dx.doi.org/10.12998/wjcc.v9.i17.4285


