Copyright
©The Author(s) 2021.
World J Clin Cases. Apr 16, 2021; 9(11): 2542-2554
Published online Apr 16, 2021. doi: 10.12998/wjcc.v9.i11.2542
Published online Apr 16, 2021. doi: 10.12998/wjcc.v9.i11.2542
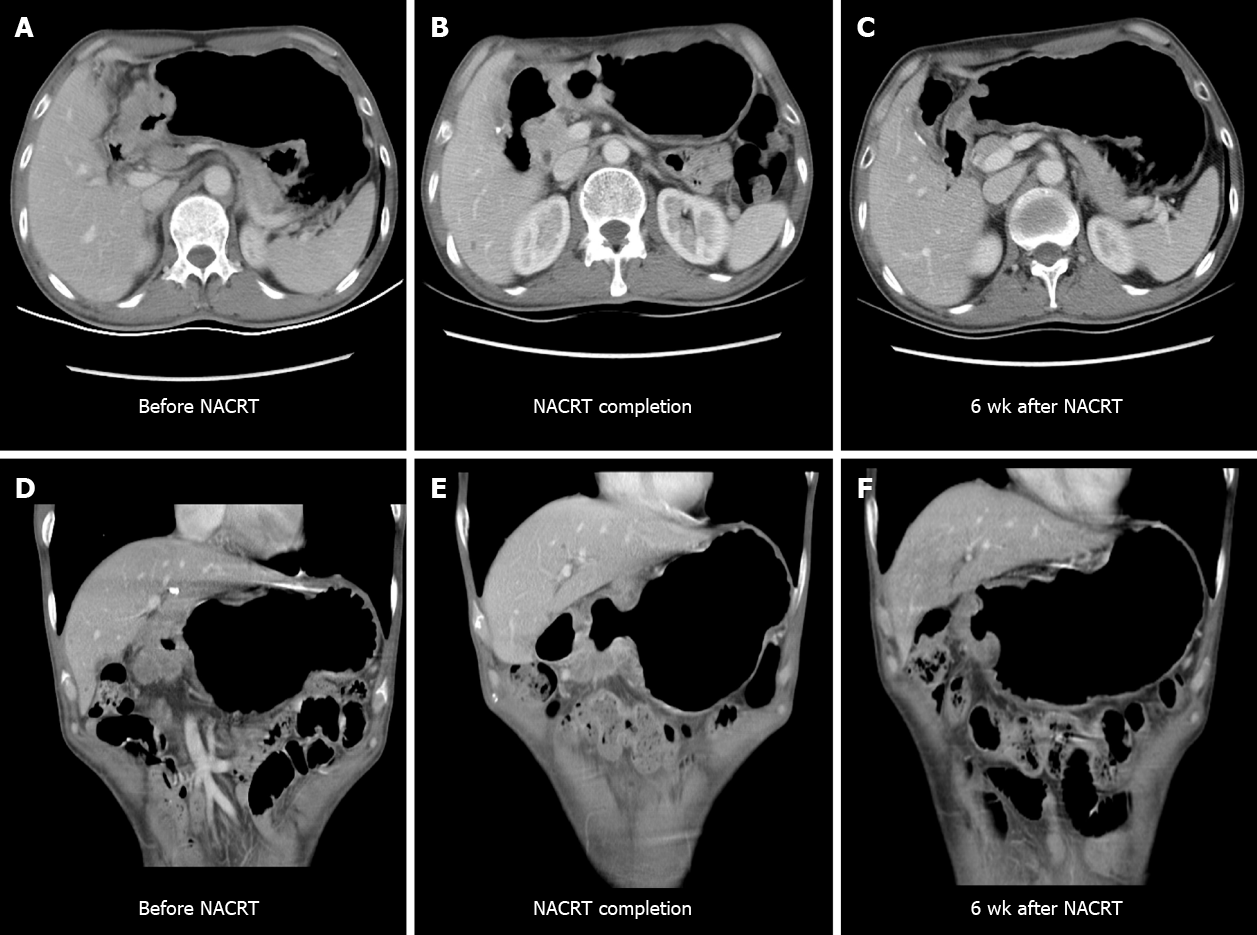
Figure 3 Enhanced abdominal computerized tomography performed before, immediately after, and 6 wk after neoadjuvant chemoradiotherapy to evaluate the response to neoadjuvant chemoradiotherapy.
Imaging after neoadjuvant chemoradiotherapy (NACRT) imaging revealed maximum thickness change from 21 mm to 12 mm (shrinking 42.9%) with lymph nodes (diameter 7 mm) in the great curvature shrinking so obviously that they could not be clearly detected in the computed tomography, but the surface of serosa was still fuzzy. The computed tomography 6 wk after neoadjuvant chemotherapy indicated a change from 12 mm to 10 mm (shrinking 16.7%) with no obviously enlarged lymph nodes around the stomach, retroperitoneal area, or pelvis. A-C: Transverse views of the lesion's change from pre-NACRT to post-NACRT; D-E: Coronal views of the lesion's change from pre-NACRT to post-NACRT.
- Citation: Liu ZN, Wang YK, Li ZY. Neoadjuvant chemoradiotherapy followed by laparoscopic distal gastrectomy in advanced gastric cancer: A case report and review of literature. World J Clin Cases 2021; 9(11): 2542-2554
- URL: https://www.wjgnet.com/2307-8960/full/v9/i11/2542.htm
- DOI: https://dx.doi.org/10.12998/wjcc.v9.i11.2542


