Copyright
©The Author(s) 2020.
World J Clin Cases. Apr 26, 2020; 8(8): 1444-1453
Published online Apr 26, 2020. doi: 10.12998/wjcc.v8.i8.1444
Published online Apr 26, 2020. doi: 10.12998/wjcc.v8.i8.1444
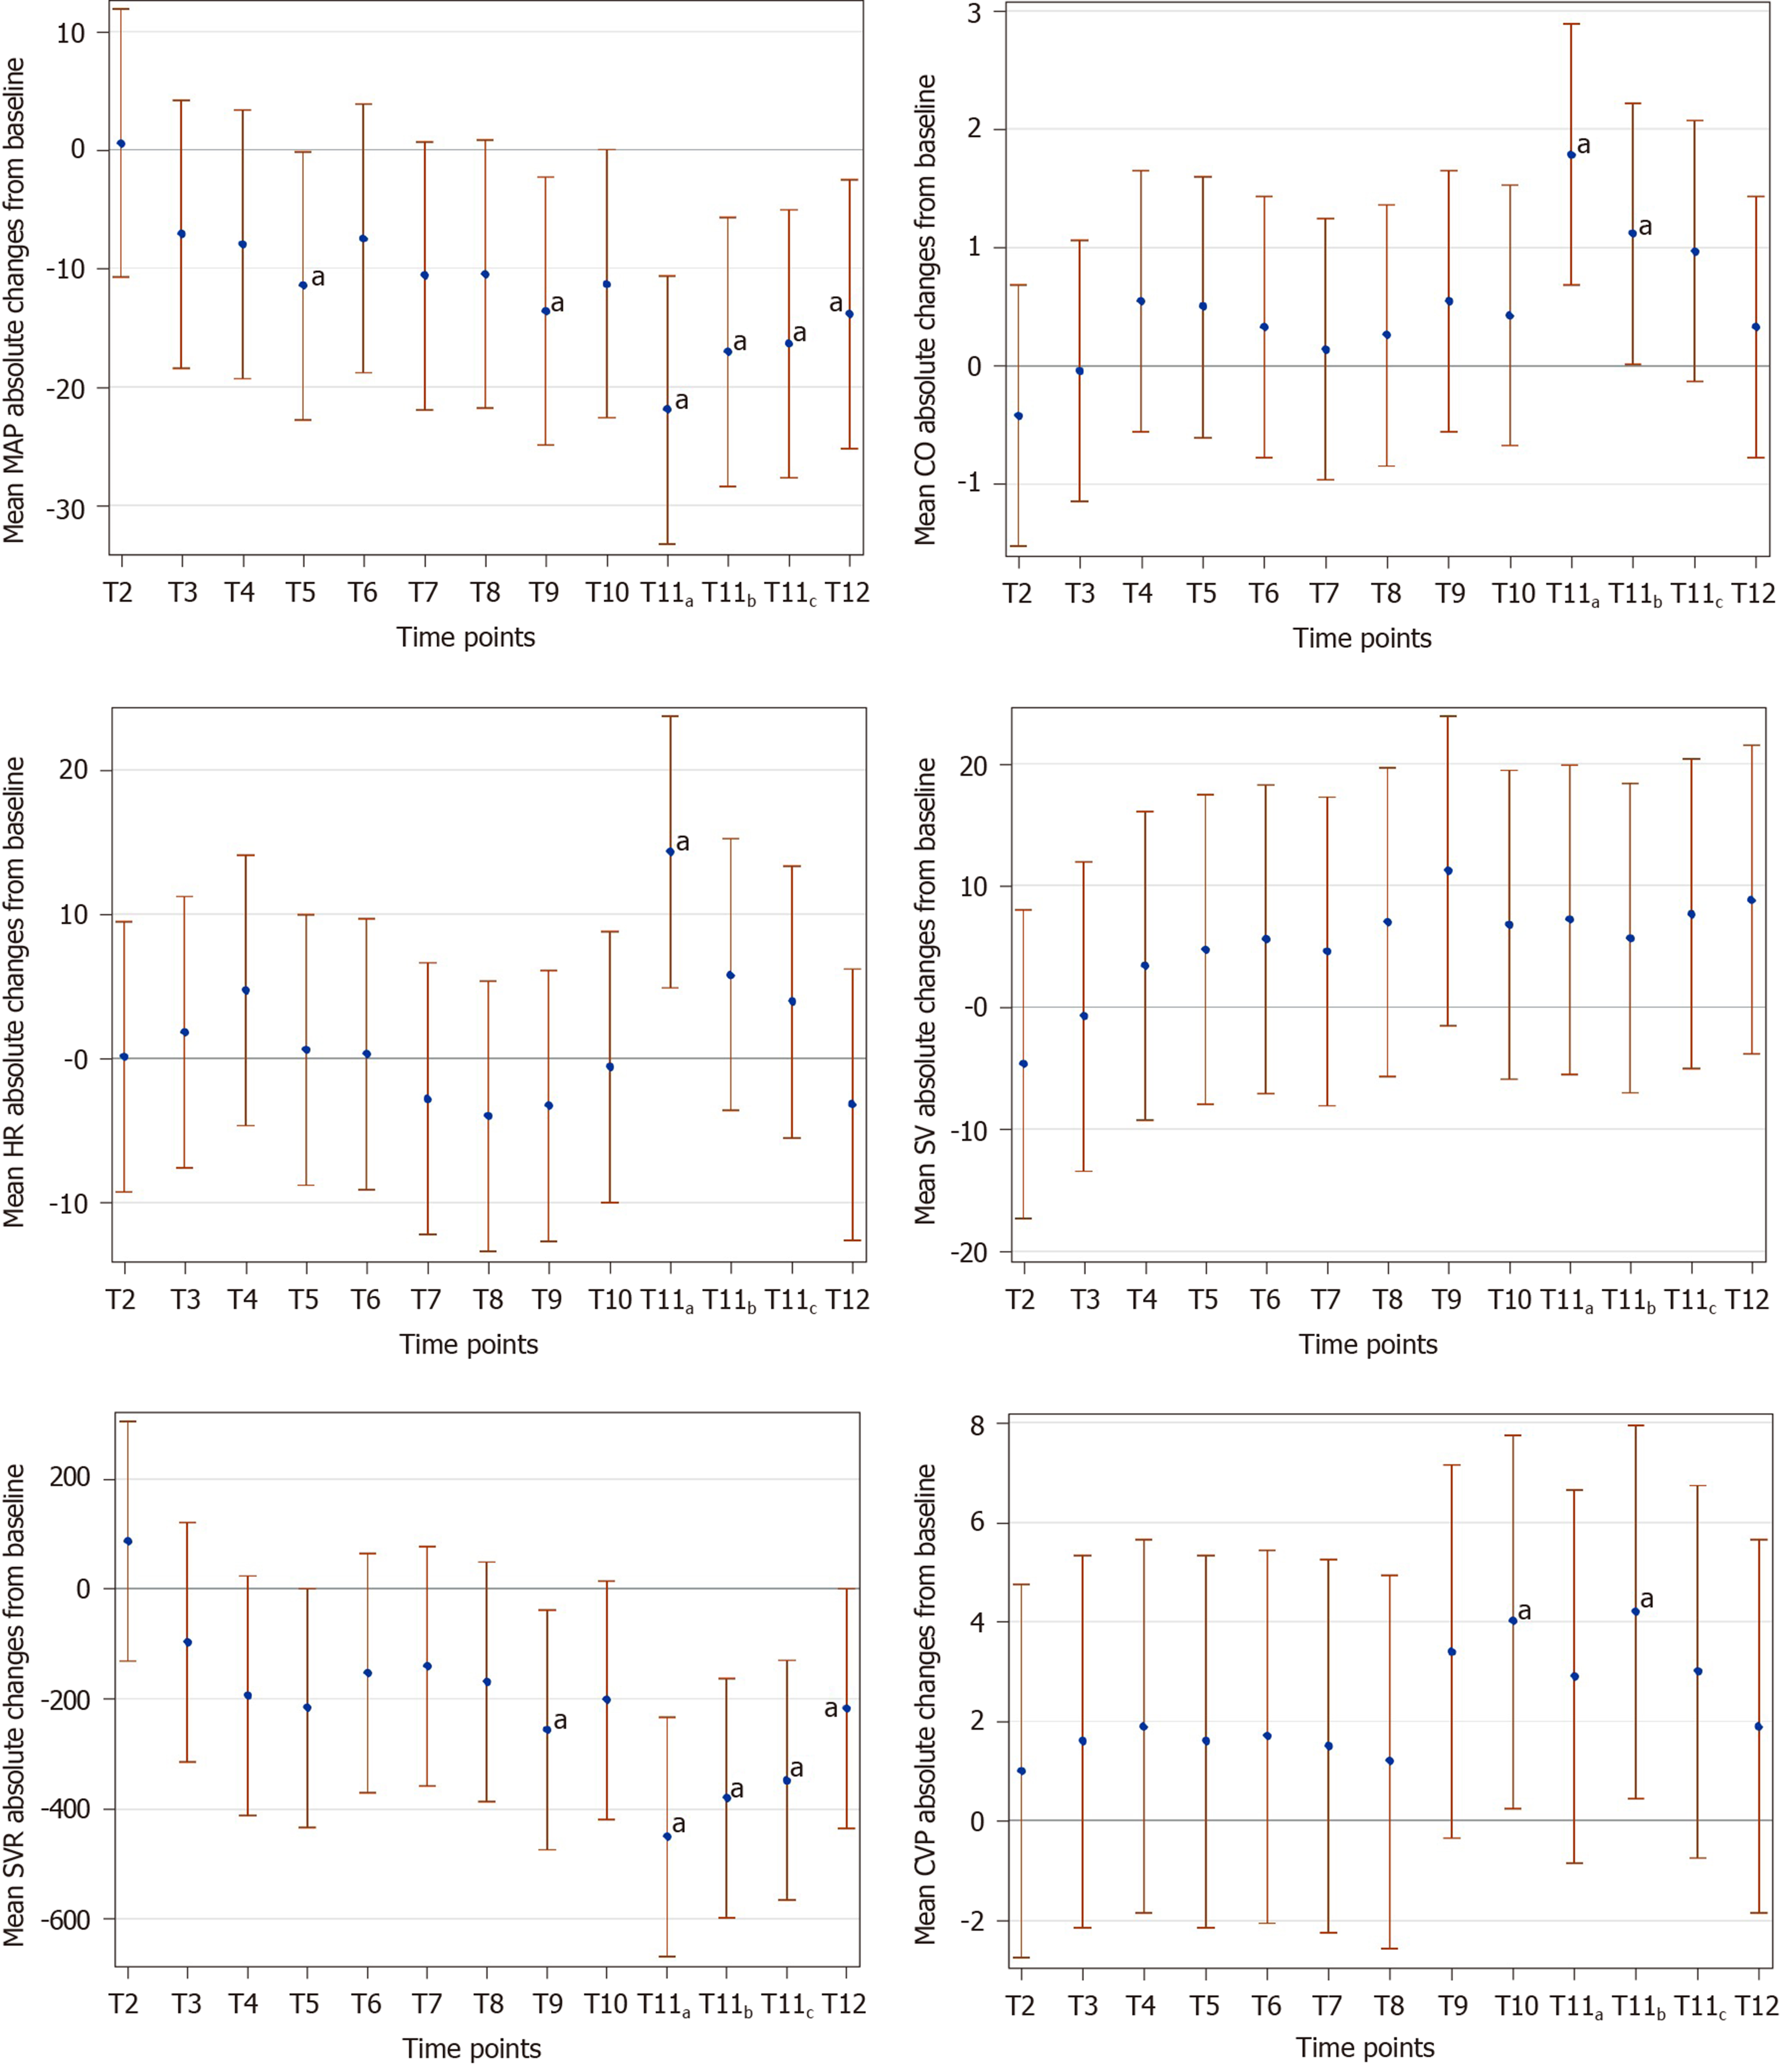
Figure 1 Mean absolute changes from baseline values for main hemodynamic variables at defined time points (n = 10).
aSignificant difference from baseline values (P < 0.05). MAP: Mean arterial pressure; CO: Cardiac output; HR: Heart rate; SV: Stroke volume; SVR: Systemic vascular resistance; CVP: Central venous pressure.
- Citation: Zhao N, Xu J, Li XG, Walline JH, Li YC, Wang L, Zhao GS, Xu MJ. Hemodynamic characteristics in preeclampsia women during cesarean delivery after spinal anesthesia with ropivacaine. World J Clin Cases 2020; 8(8): 1444-1453
- URL: https://www.wjgnet.com/2307-8960/full/v8/i8/1444.htm
- DOI: https://dx.doi.org/10.12998/wjcc.v8.i8.1444


