
















©The Author(s) 2020.
World J Clin Cases. Nov 26, 2020; 8(22): 5618-5624
Published online Nov 26, 2020. doi: 10.12998/wjcc.v8.i22.5618
Published online Nov 26, 2020. doi: 10.12998/wjcc.v8.i22.5618
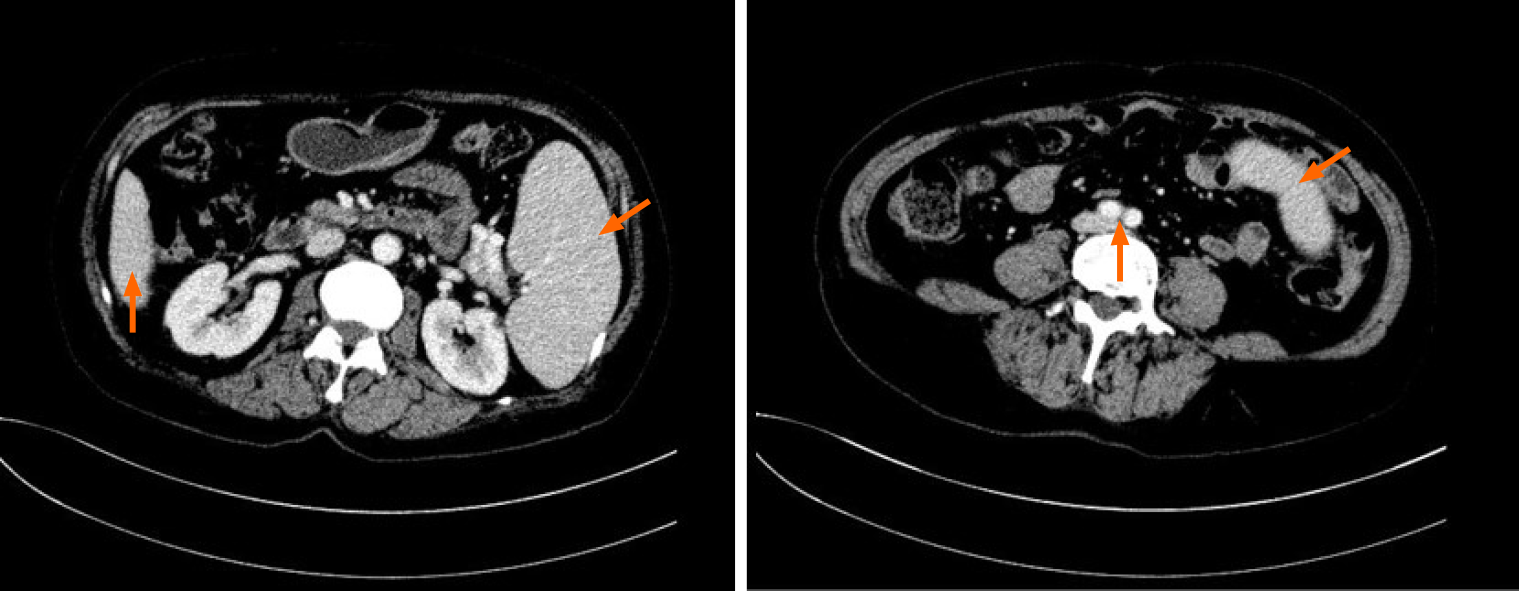
Figure 1 Computed tomography images showing splenomegaly.
A and B: Abdominal computed tomography images showing that the inferior margin of the spleen was lower than that of the liver (A) and reached the level of abdominal aortic bifurcation (B).
- Citation: Zhou FP, Wang CC, Du HP, Cao SB, Zhang J. Primary myelofibrosis with concurrent CALR and MPL mutations: A case report. World J Clin Cases 2020; 8(22): 5618-5624
- URL: https://www.wjgnet.com/2307-8960/full/v8/i22/5618.htm
- DOI: https://dx.doi.org/10.12998/wjcc.v8.i22.5618