Copyright
©The Author(s) 2020.
World J Clin Cases. May 26, 2020; 8(10): 1988-1994
Published online May 26, 2020. doi: 10.12998/wjcc.v8.i10.1988
Published online May 26, 2020. doi: 10.12998/wjcc.v8.i10.1988
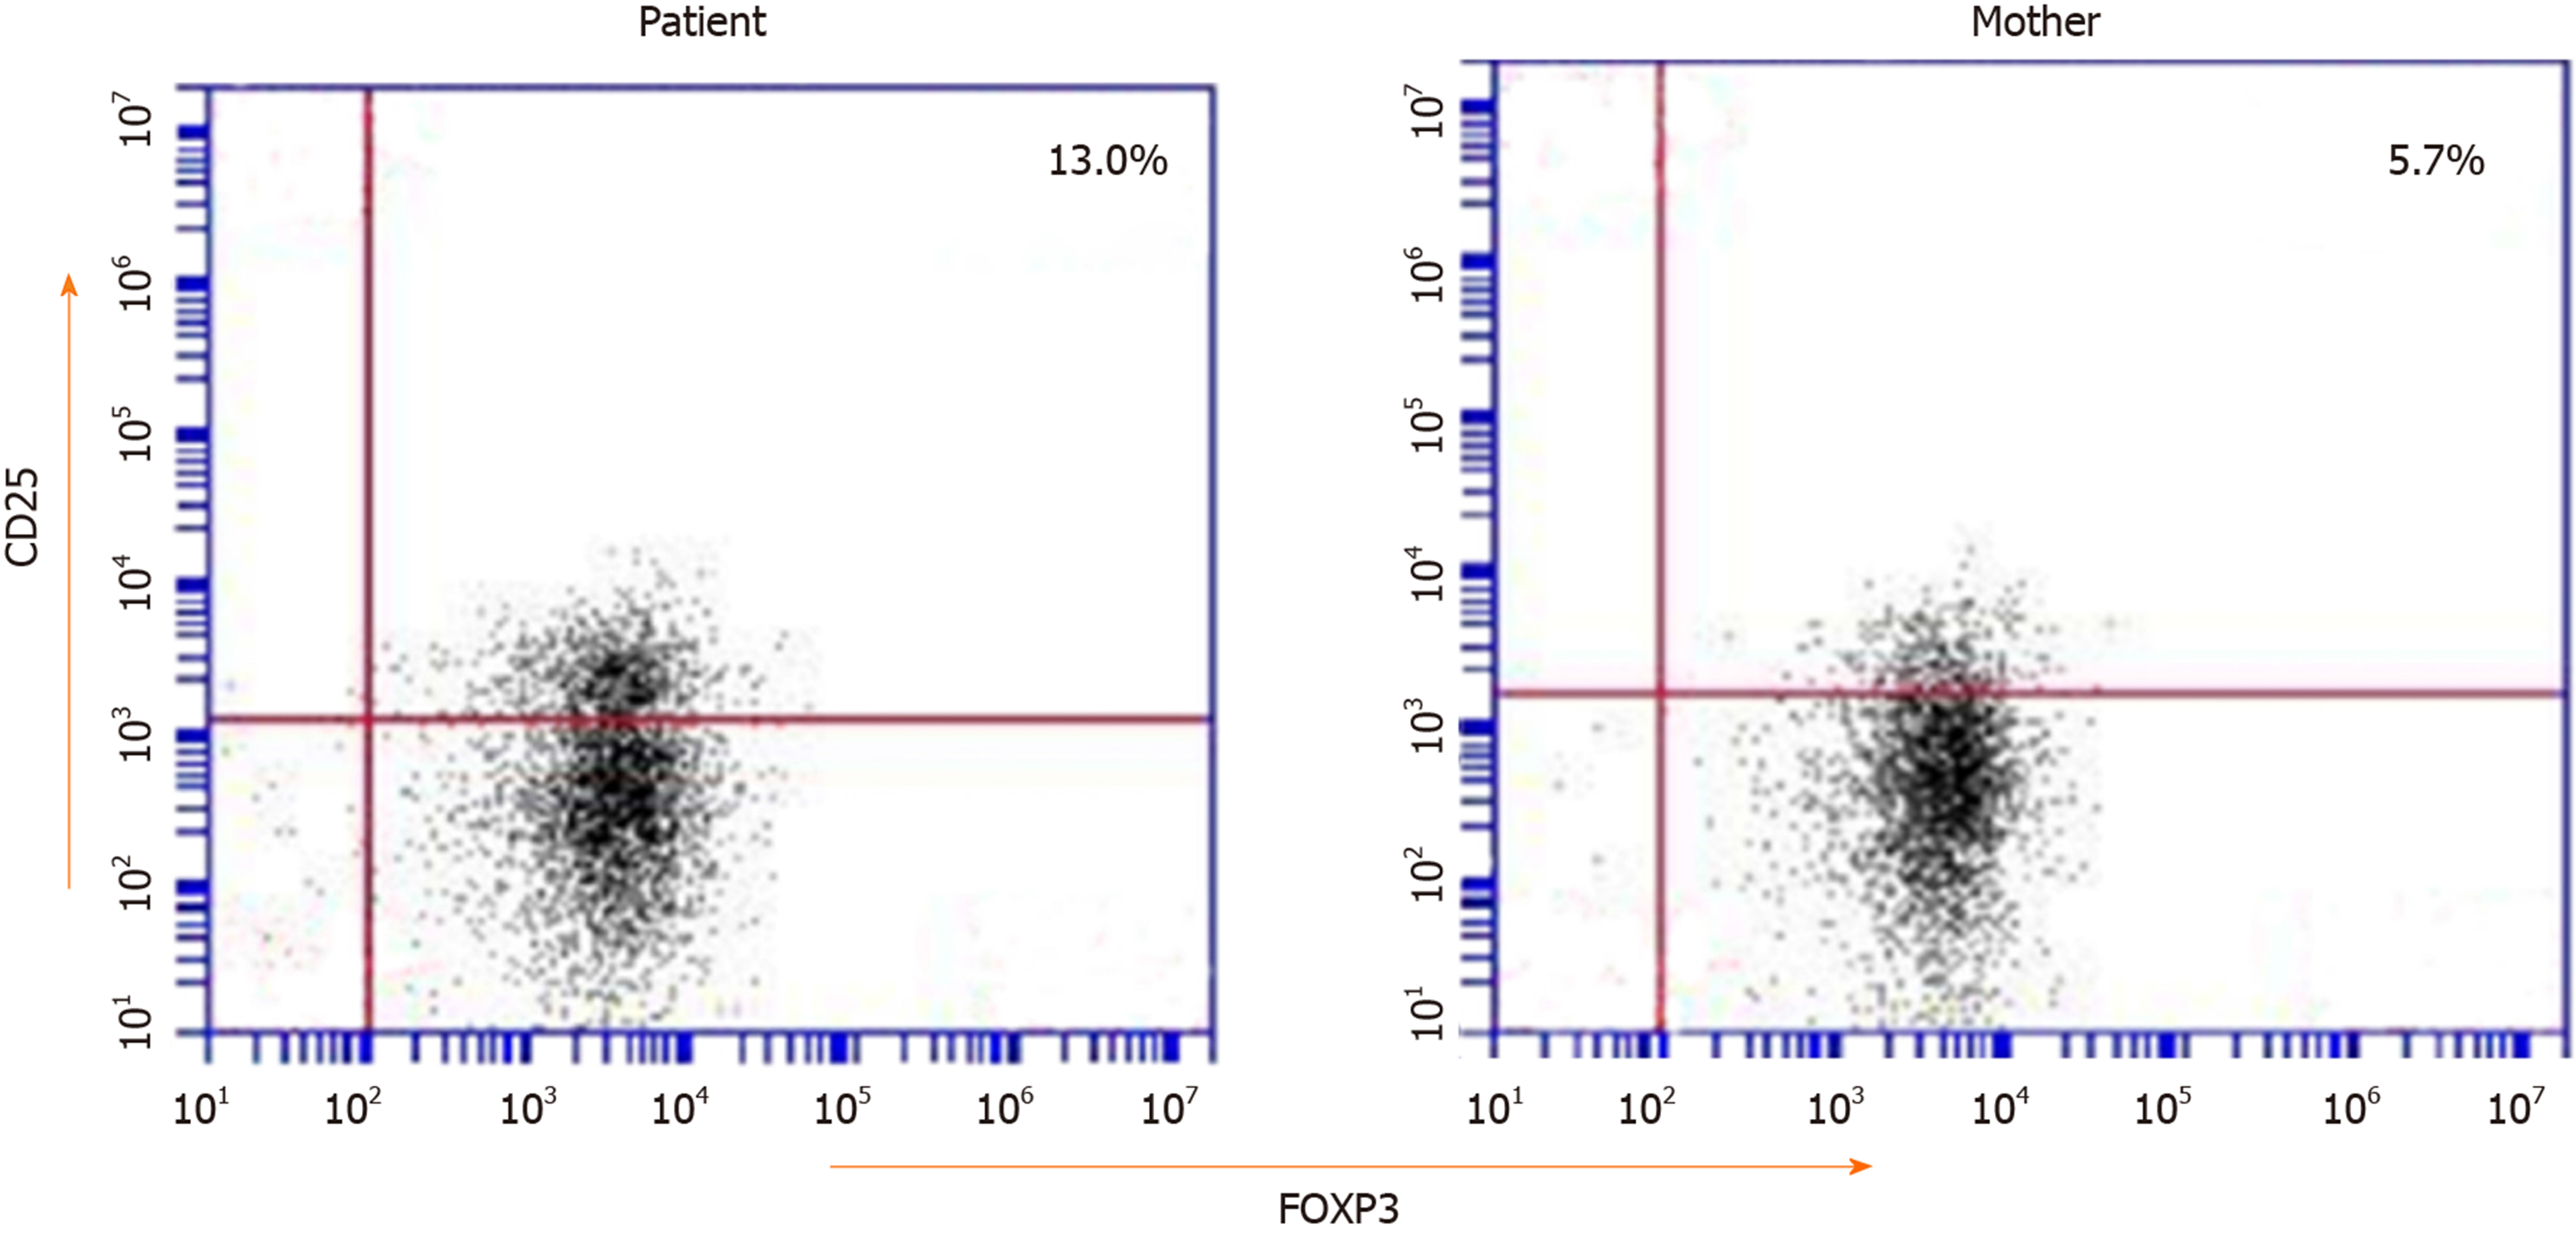
Figure 2 Flow cytometry showing CD25+FOXP3+ regulatory cells in the CD4+T cell population in peripheral blood.
The red number in each quadrant indicates the percentage of the individual. The percentages of CD25+FOXP3+T cells of the patient and his mother were not reducing (reference range 5.1%-12.7%).
- Citation: Su N, Chen C, Zhou X, Ma GD, Chen RL, Tian C. Early-onset refractory diarrhea due to immune dysregulation, polyendocrinopathy, enteropathy, X-linked syndrome associated with a novel mutation in the FOXP3 gene: A case report. World J Clin Cases 2020; 8(10): 1988-1994
- URL: https://www.wjgnet.com/2307-8960/full/v8/i10/1988.htm
- DOI: https://dx.doi.org/10.12998/wjcc.v8.i10.1988


