Copyright
©The Author(s) 2019.
World J Clin Cases. Oct 6, 2019; 7(19): 3012-3017
Published online Oct 6, 2019. doi: 10.12998/wjcc.v7.i19.3012
Published online Oct 6, 2019. doi: 10.12998/wjcc.v7.i19.3012
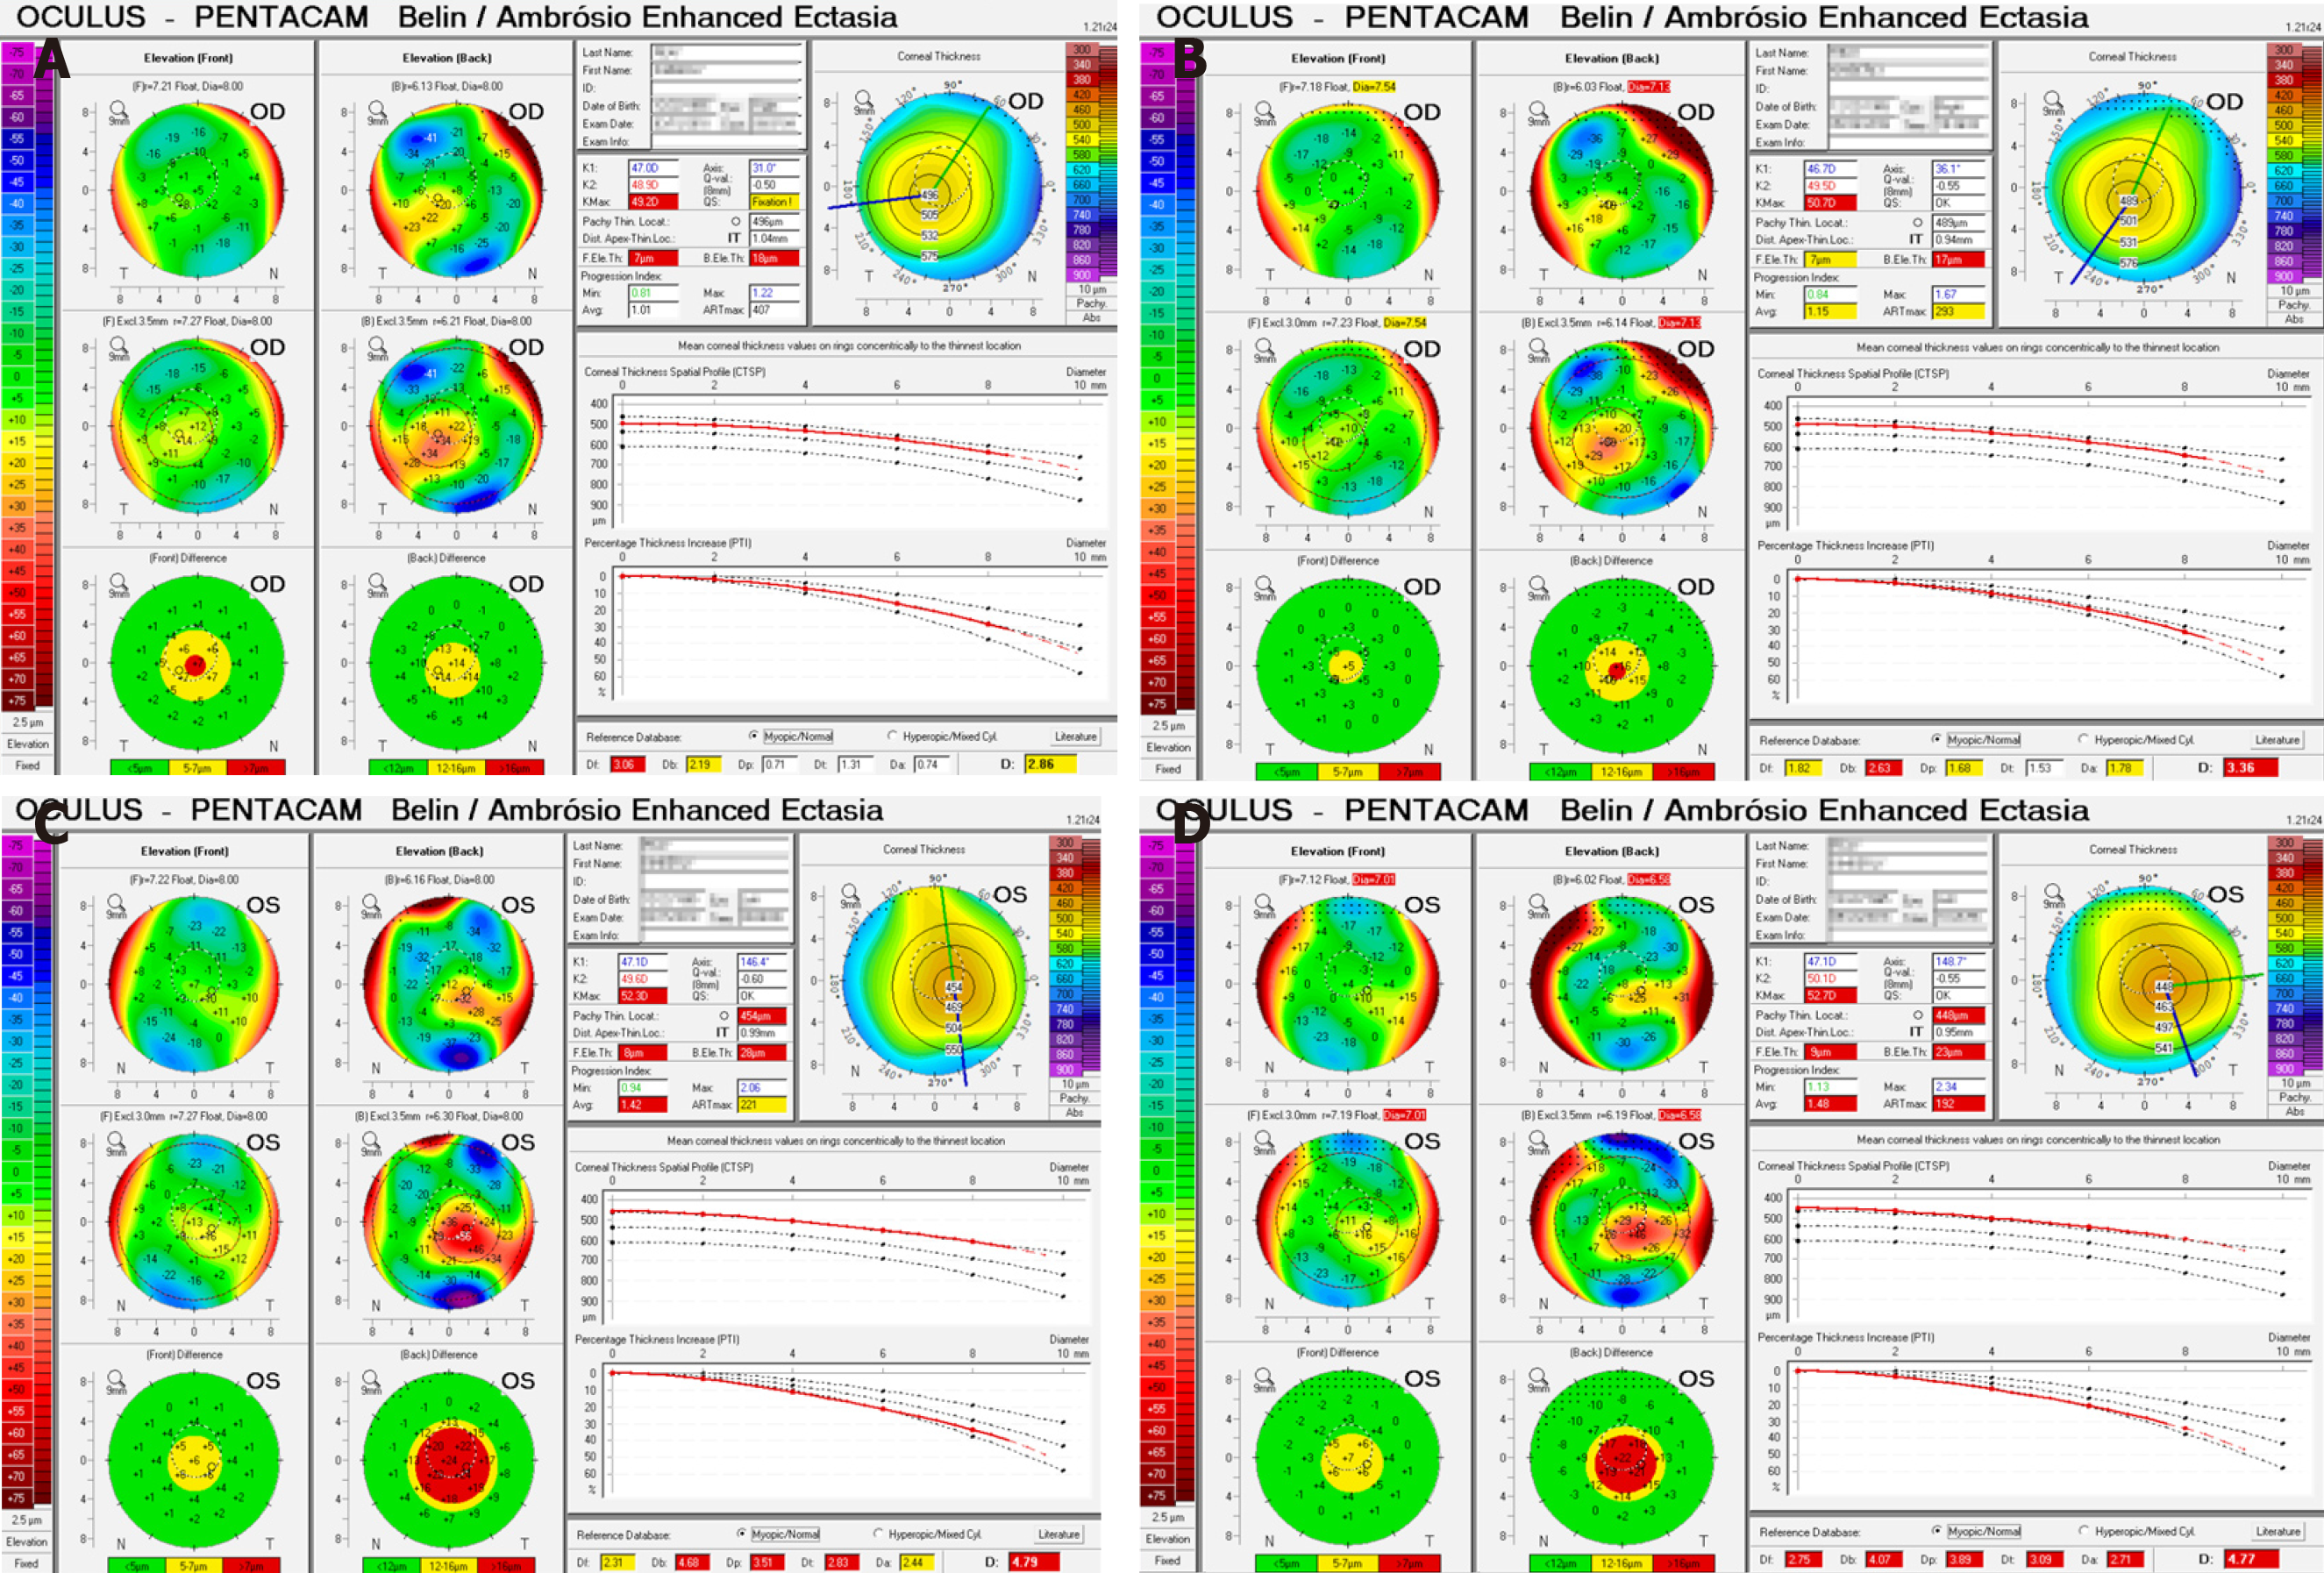
Figure 1 Pentacam Belin/Ambrosio enhanced ectasia display highlighting abnormal values of deviation of front elevation difference map, deviation of back elevation difference map, deviation of average pachymetric progression, deviation of minimum thickness, deviation of Ambrosio relational thickness (ART max), and total deviation.
A: Initial examination of right eye; B. 2 Mo follow-up of right eye; C: Initial examination of left eye; D: 2-Mo follow-up of left eye. Df: Deviation of front; Db: Deviation of back; Dp: Deviation of average pachymetric; Dt: Deviation of minimum thickness; Da: Deviation of Ambrosio; D: Total deviation.
- Citation: Moshirfar M, Skanchy DF, Gomez AT, Ronquillo YC, Buckner B, Hoopes PC. Keratoconus in a patient with Alport syndrome: A case report. World J Clin Cases 2019; 7(19): 3012-3017
- URL: https://www.wjgnet.com/2307-8960/full/v7/i19/3012.htm
- DOI: https://dx.doi.org/10.12998/wjcc.v7.i19.3012


