Copyright
©The Author(s) 2019.
World J Clin Cases. Sep 6, 2019; 7(17): 2427-2437
Published online Sep 6, 2019. doi: 10.12998/wjcc.v7.i17.2427
Published online Sep 6, 2019. doi: 10.12998/wjcc.v7.i17.2427
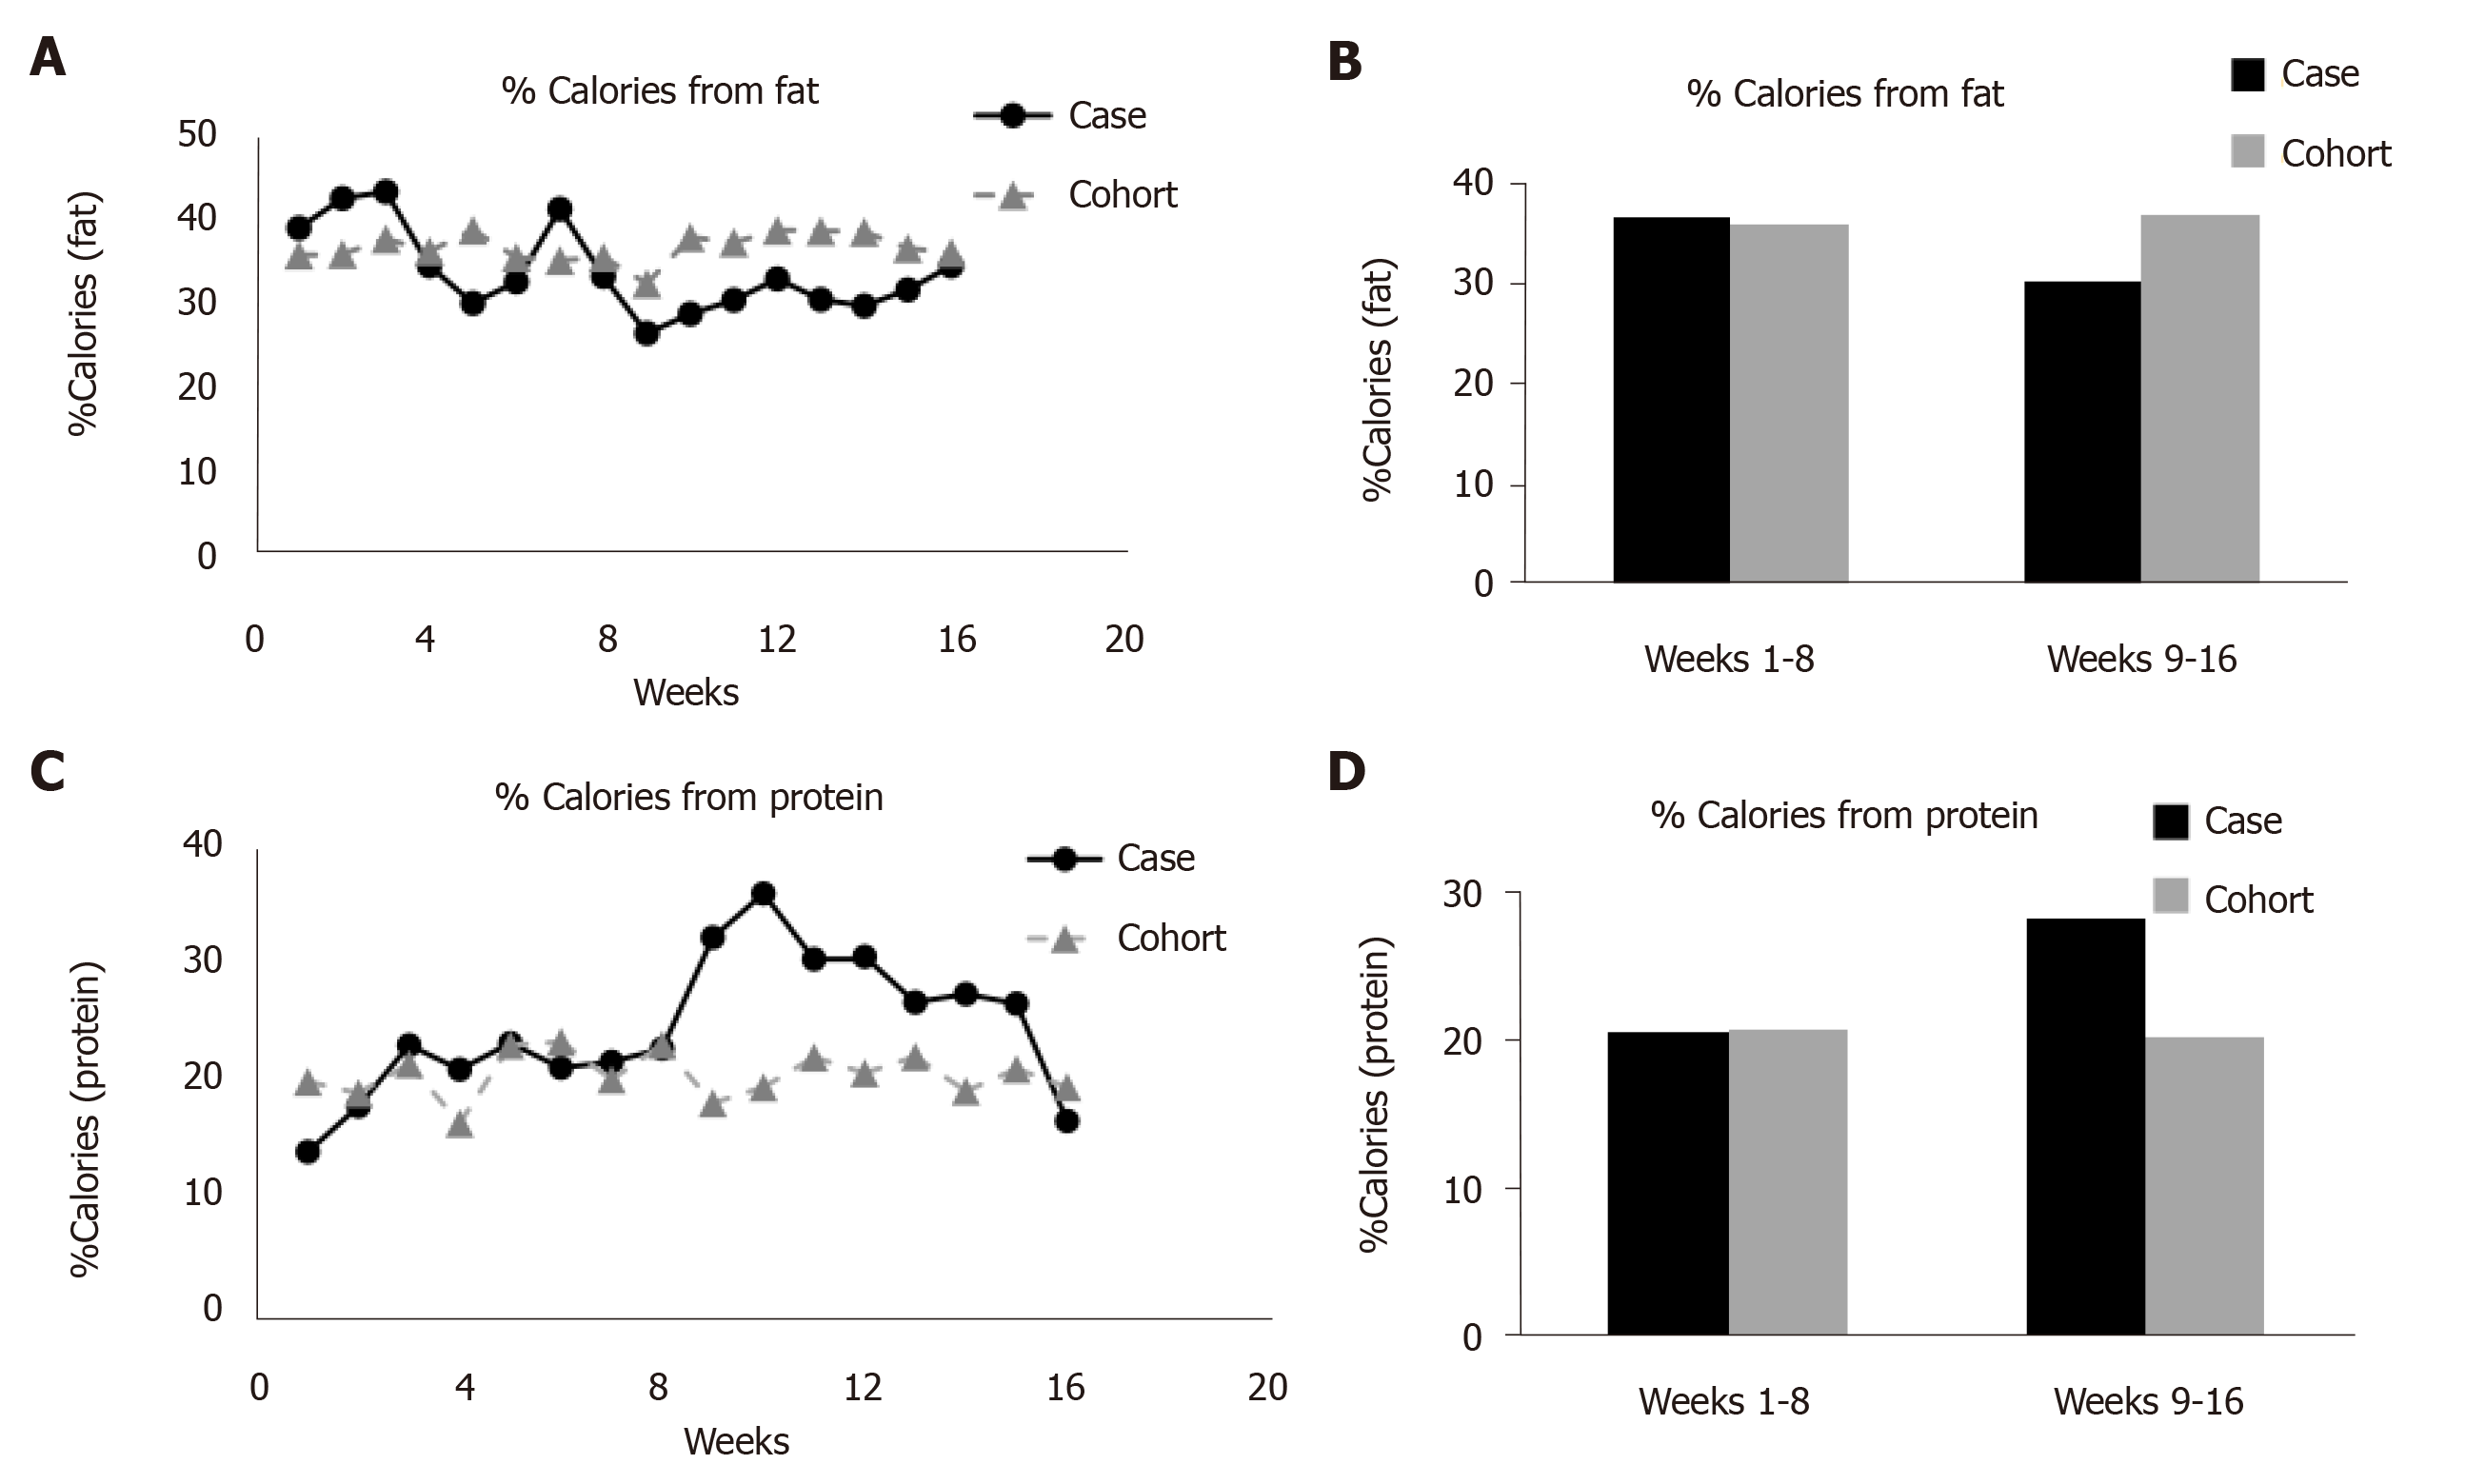
Figure 3 Percentage calories from fat.
A: Percentage fat intake of the participant and cohort during the course of the study; B: The average percentage fat consumption during the first and second phases of intervention; C: Percentage protein consumption of the participant and cohort during the course of the study; D: The average percentage protein intake during the first and second phases of intervention.
- Citation: Gorgey AS, Lester RM, Ghatas MP, Sistrun SN, Lavis T. Dietary manipulation and testosterone replacement therapy may explain changes in body composition after spinal cord injury: A retrospective case report. World J Clin Cases 2019; 7(17): 2427-2437
- URL: https://www.wjgnet.com/2307-8960/full/v7/i17/2427.htm
- DOI: https://dx.doi.org/10.12998/wjcc.v7.i17.2427


