Copyright
©The Author(s) 2019.
World J Clin Cases. Sep 6, 2019; 7(17): 2427-2437
Published online Sep 6, 2019. doi: 10.12998/wjcc.v7.i17.2427
Published online Sep 6, 2019. doi: 10.12998/wjcc.v7.i17.2427
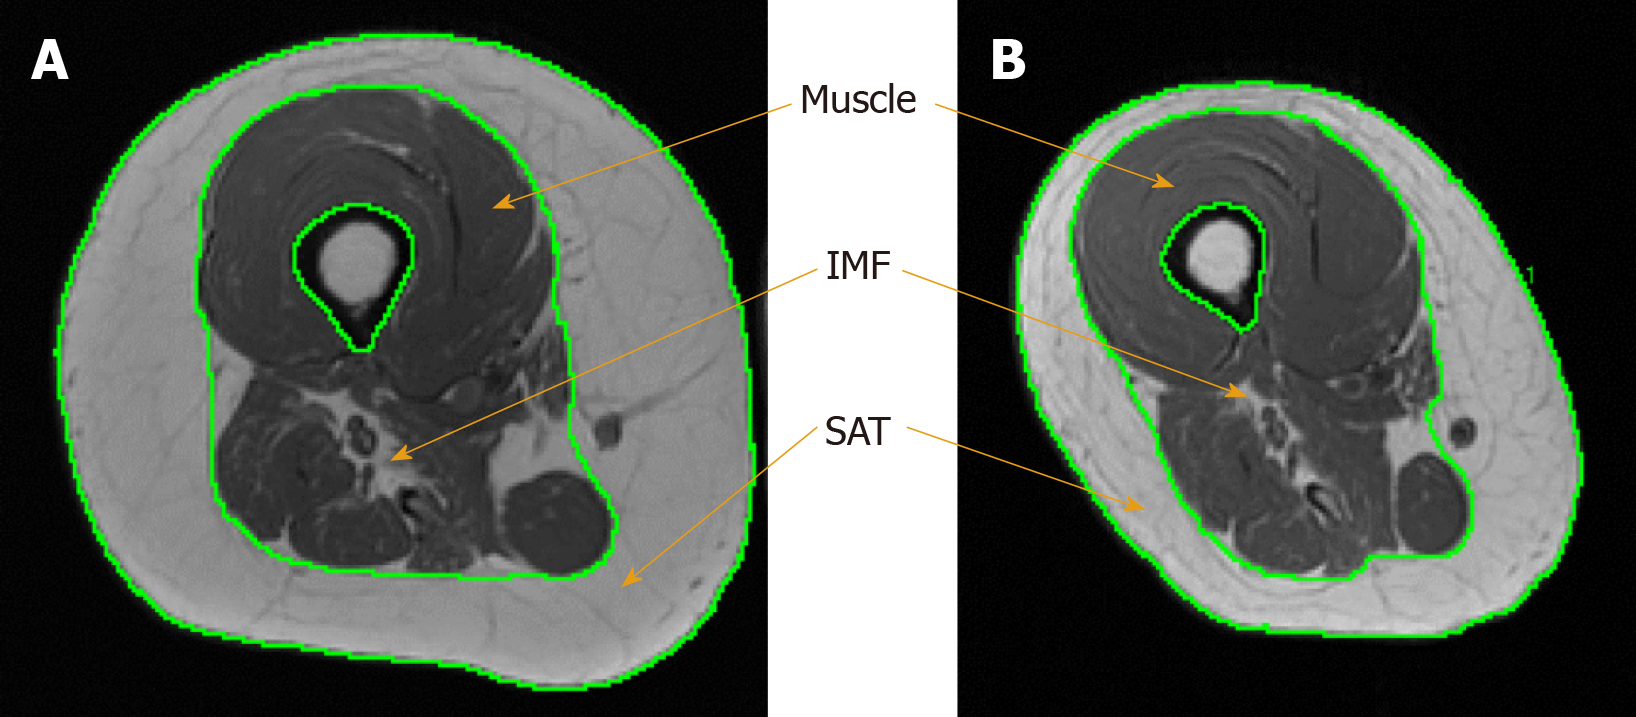
Figure 1 Robust changes in subcutaneous adipose tissue, intramuscular fat and muscle size between baseline and post-intervention measurements.
A: Baseline magnetic resonance imaging (MRI) of the right thigh showing large subcutaneous adipose tissue (SAT) and intramuscular fat (IMF) depots prior to dietary intervention; B: Post-intervention matched MRI of right thigh after 16 wk of intervention showing reduced SAT and IMF depots and increased muscle cross-sectional area.
- Citation: Gorgey AS, Lester RM, Ghatas MP, Sistrun SN, Lavis T. Dietary manipulation and testosterone replacement therapy may explain changes in body composition after spinal cord injury: A retrospective case report. World J Clin Cases 2019; 7(17): 2427-2437
- URL: https://www.wjgnet.com/2307-8960/full/v7/i17/2427.htm
- DOI: https://dx.doi.org/10.12998/wjcc.v7.i17.2427


