Copyright
©The Author(s) 2019.
World J Clin Cases. Aug 6, 2019; 7(15): 2081-2086
Published online Aug 6, 2019. doi: 10.12998/wjcc.v7.i15.2081
Published online Aug 6, 2019. doi: 10.12998/wjcc.v7.i15.2081
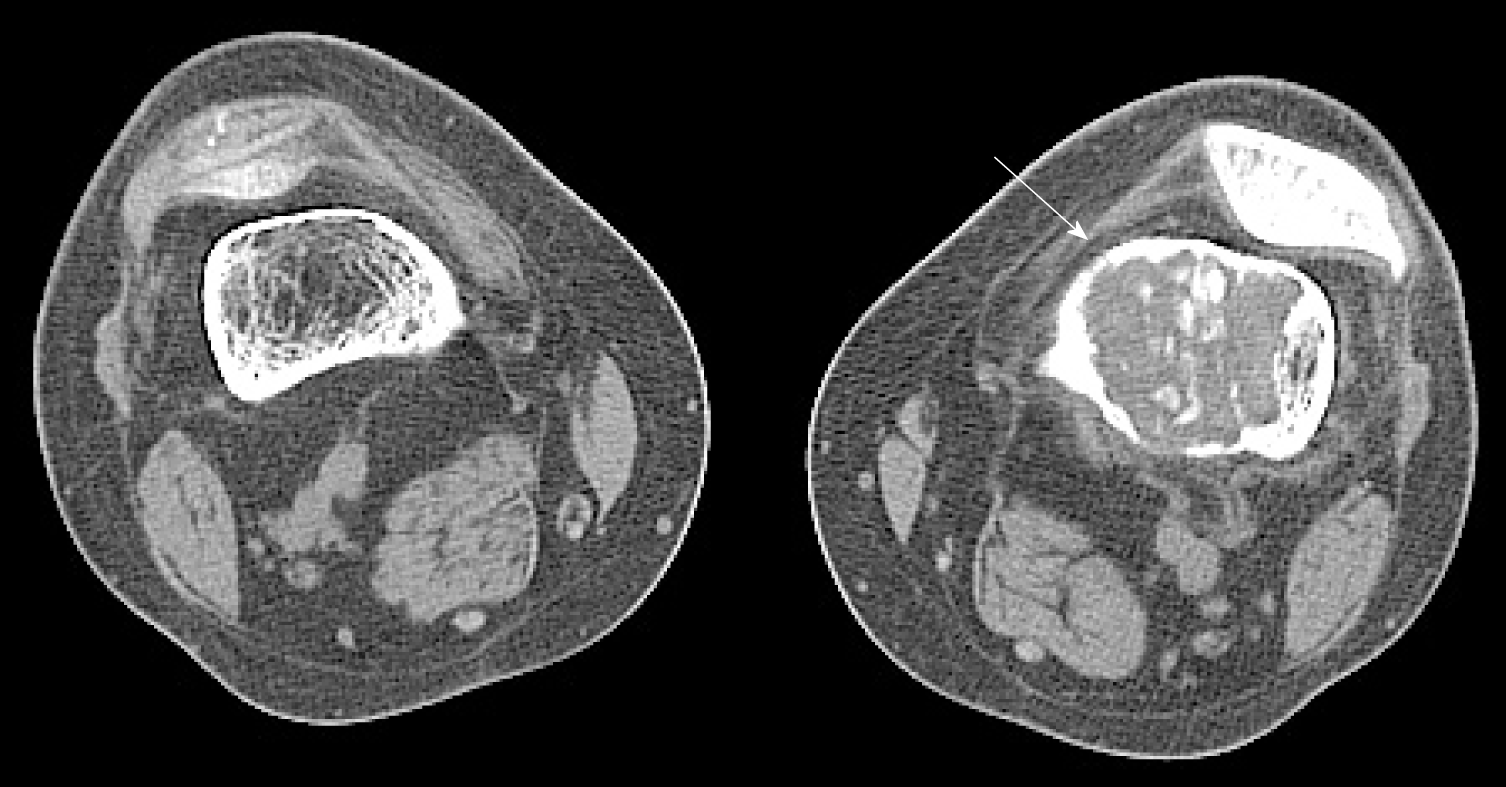
Figure 2 Computed tomography scans of knee joints.
Mixed density shadows are shown in the intramedullary cavity of the left femur (arrow). Computed tomography values are 45-70 HU.
- Citation: Tang D, Wang XM, Zhang YS, Mi XX. Oncogenic osteomalacia caused by a phosphaturic mesenchymal tumor of the femur: A case report. World J Clin Cases 2019; 7(15): 2081-2086
- URL: https://www.wjgnet.com/2307-8960/full/v7/i15/2081.htm
- DOI: https://dx.doi.org/10.12998/wjcc.v7.i15.2081


