Copyright
©The Author(s) 2019.
World J Clin Cases. Aug 6, 2019; 7(15): 1964-1977
Published online Aug 6, 2019. doi: 10.12998/wjcc.v7.i15.1964
Published online Aug 6, 2019. doi: 10.12998/wjcc.v7.i15.1964
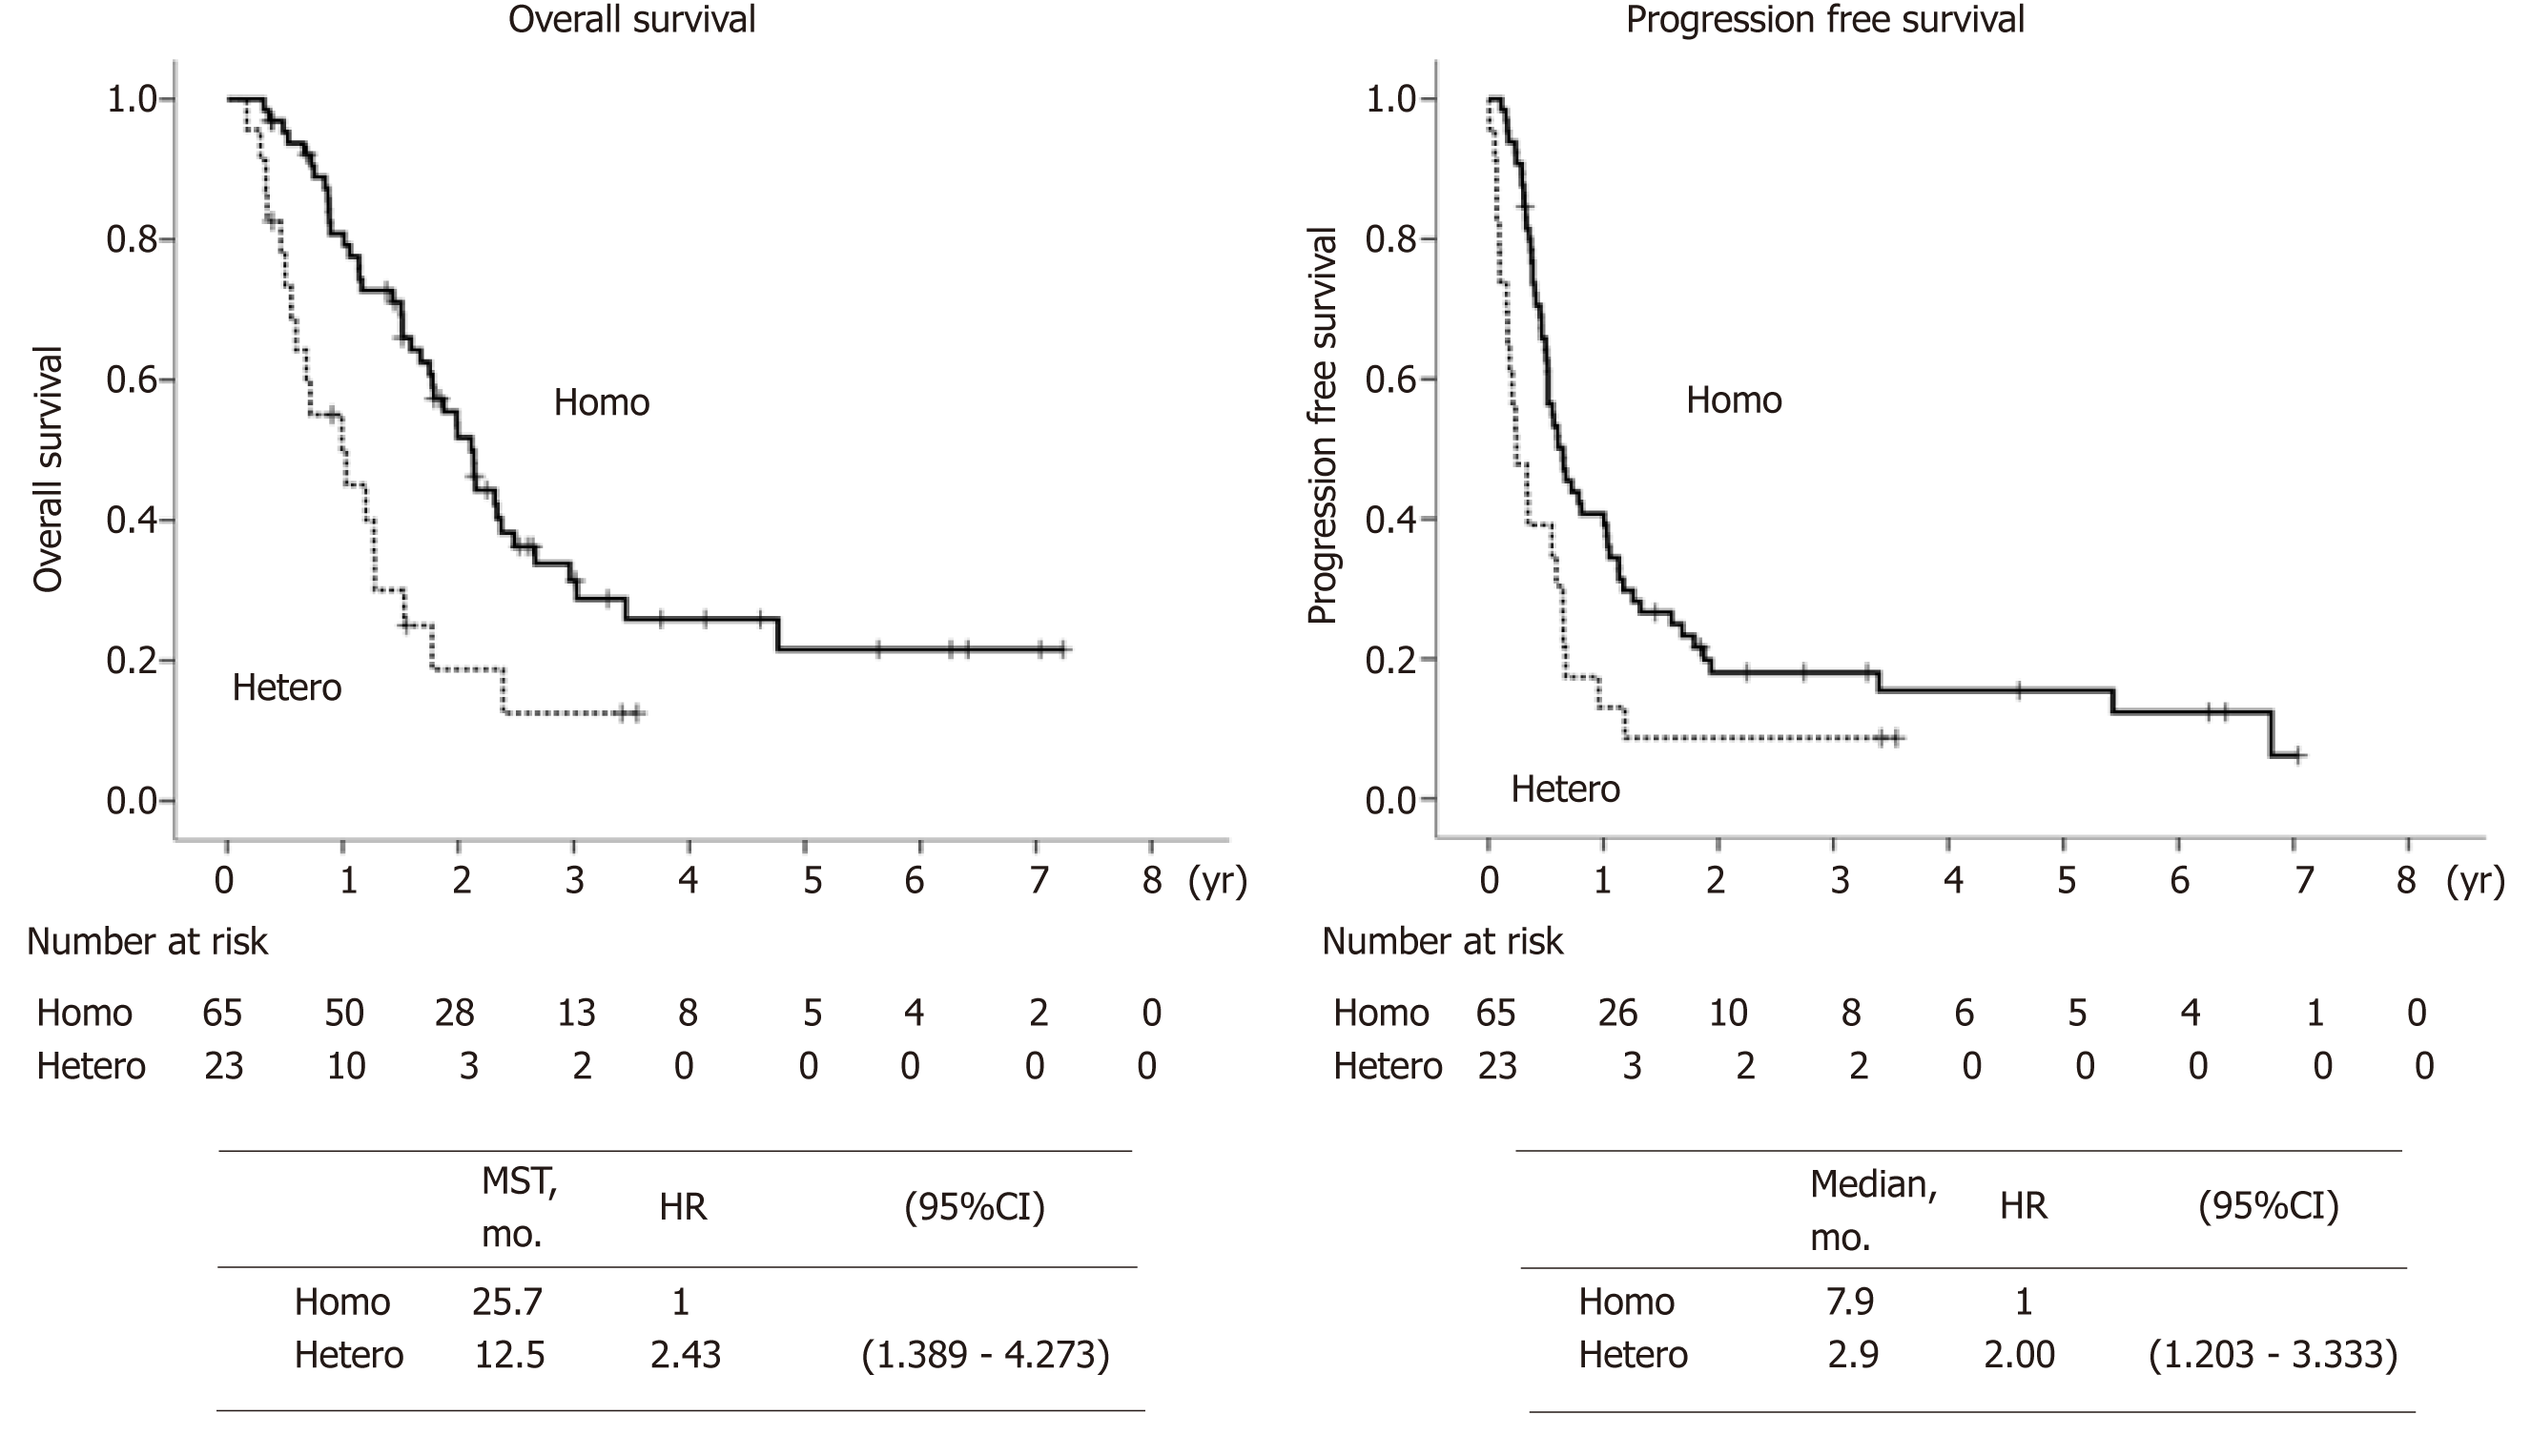
Figure 4 OS and PFS with or without intratumoral human epidermal growth factor receptor 2 heterogeneity.
Kaplan-Meier curves of OS (left) and PFS (right) in both groups was shown with the median follow-up of 18.5 mo (range, 4.7-88.0 mo). MST and median PST in the Hetero group were significantly worse than those in the Homo group. MST: Median survival time; HR: Hazard ratio; CI: Confidence interval; OS: Overall survival; PFS: Progression-free survival.
- Citation: Kaito A, Kuwata T, Tokunaga M, Shitara K, Sato R, Akimoto T, Kinoshita T. HER2 heterogeneity is a poor prognosticator for HER2-positive gastric cancer. World J Clin Cases 2019; 7(15): 1964-1977
- URL: https://www.wjgnet.com/2307-8960/full/v7/i15/1964.htm
- DOI: https://dx.doi.org/10.12998/wjcc.v7.i15.1964


