Copyright
©The Author(s) 2018.
World J Clin Cases. Aug 16, 2018; 6(8): 219-223
Published online Aug 16, 2018. doi: 10.12998/wjcc.v6.i8.219
Published online Aug 16, 2018. doi: 10.12998/wjcc.v6.i8.219
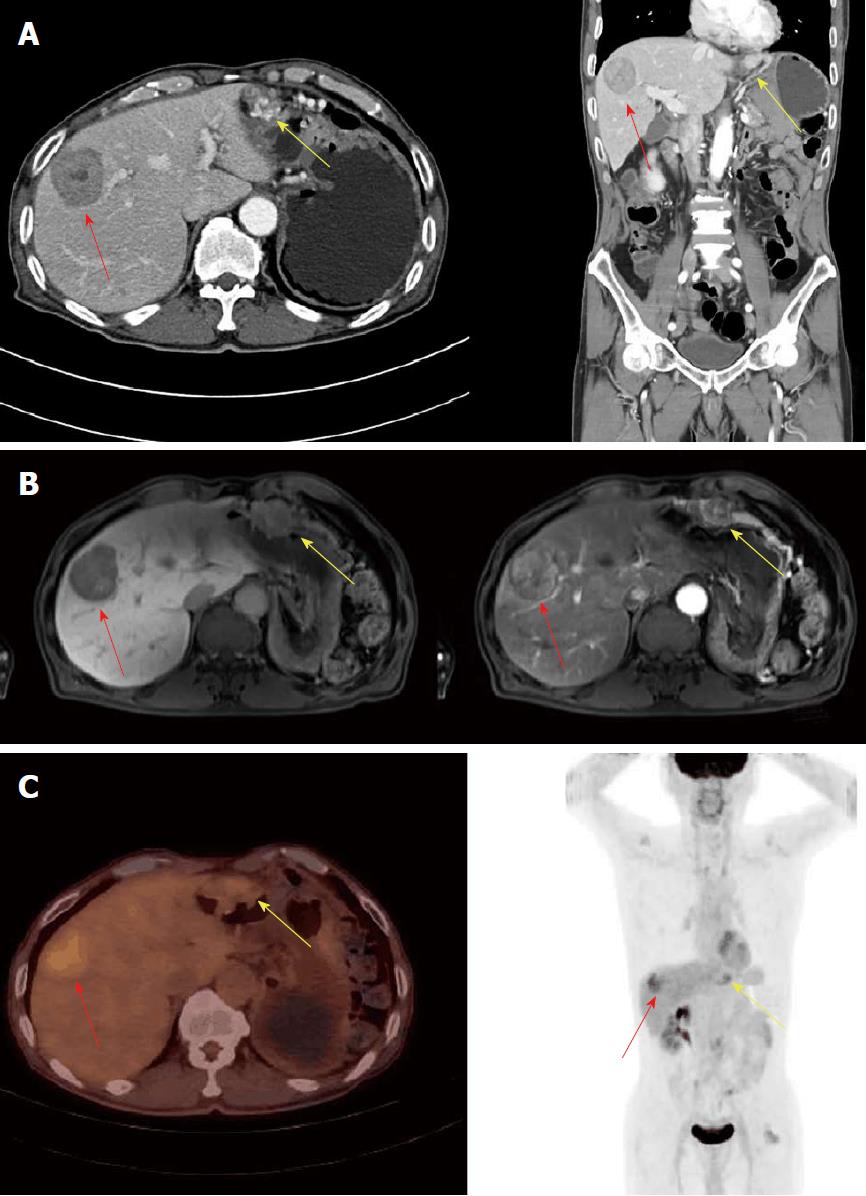
Figure 1 Diagnosis imaging of the patient.
A: Computed tomography showed a 43 mm hypodense mass at S8 of the liver (red arrow) and a 23 mm sized hypervacular mass at the great curvature side of stomach (yellow arrow). B: Magnetic resonance imaging showed a well-defined encapsulated lesion (red arrow) in S8 of the liver, which showed a strong enhancement during the arterial dominant phase, with wash out during the delayed phase. The mass (red arrow) in the greater curvature of the stomach was accompanied by engorgement of the gastroepiploic vein. C: Fluorine-18 fluorodeoxyglucose positron emission tomography/computed tomography images showed a hyper-vascular mass at the great curvature side of stomach (yellow arrow) and a hypervascular metastatic mass at S8 of liver (red arrow).
- Citation: Seo HI, Kim DI, Chung Y, Choi CI, Kim M, Yun S, Kim S, Park DY. Multimodal treatments of right gastroepiploic arterial leiomyosarcoma with hepatic metastasis: A case report and review of the literature. World J Clin Cases 2018; 6(8): 219-223
- URL: https://www.wjgnet.com/2307-8960/full/v6/i8/219.htm
- DOI: https://dx.doi.org/10.12998/wjcc.v6.i8.219


