Copyright
©The Author(s) 2018.
World J Clin Cases. Dec 6, 2018; 6(15): 961-984
Published online Dec 6, 2018. doi: 10.12998/wjcc.v6.i15.961
Published online Dec 6, 2018. doi: 10.12998/wjcc.v6.i15.961
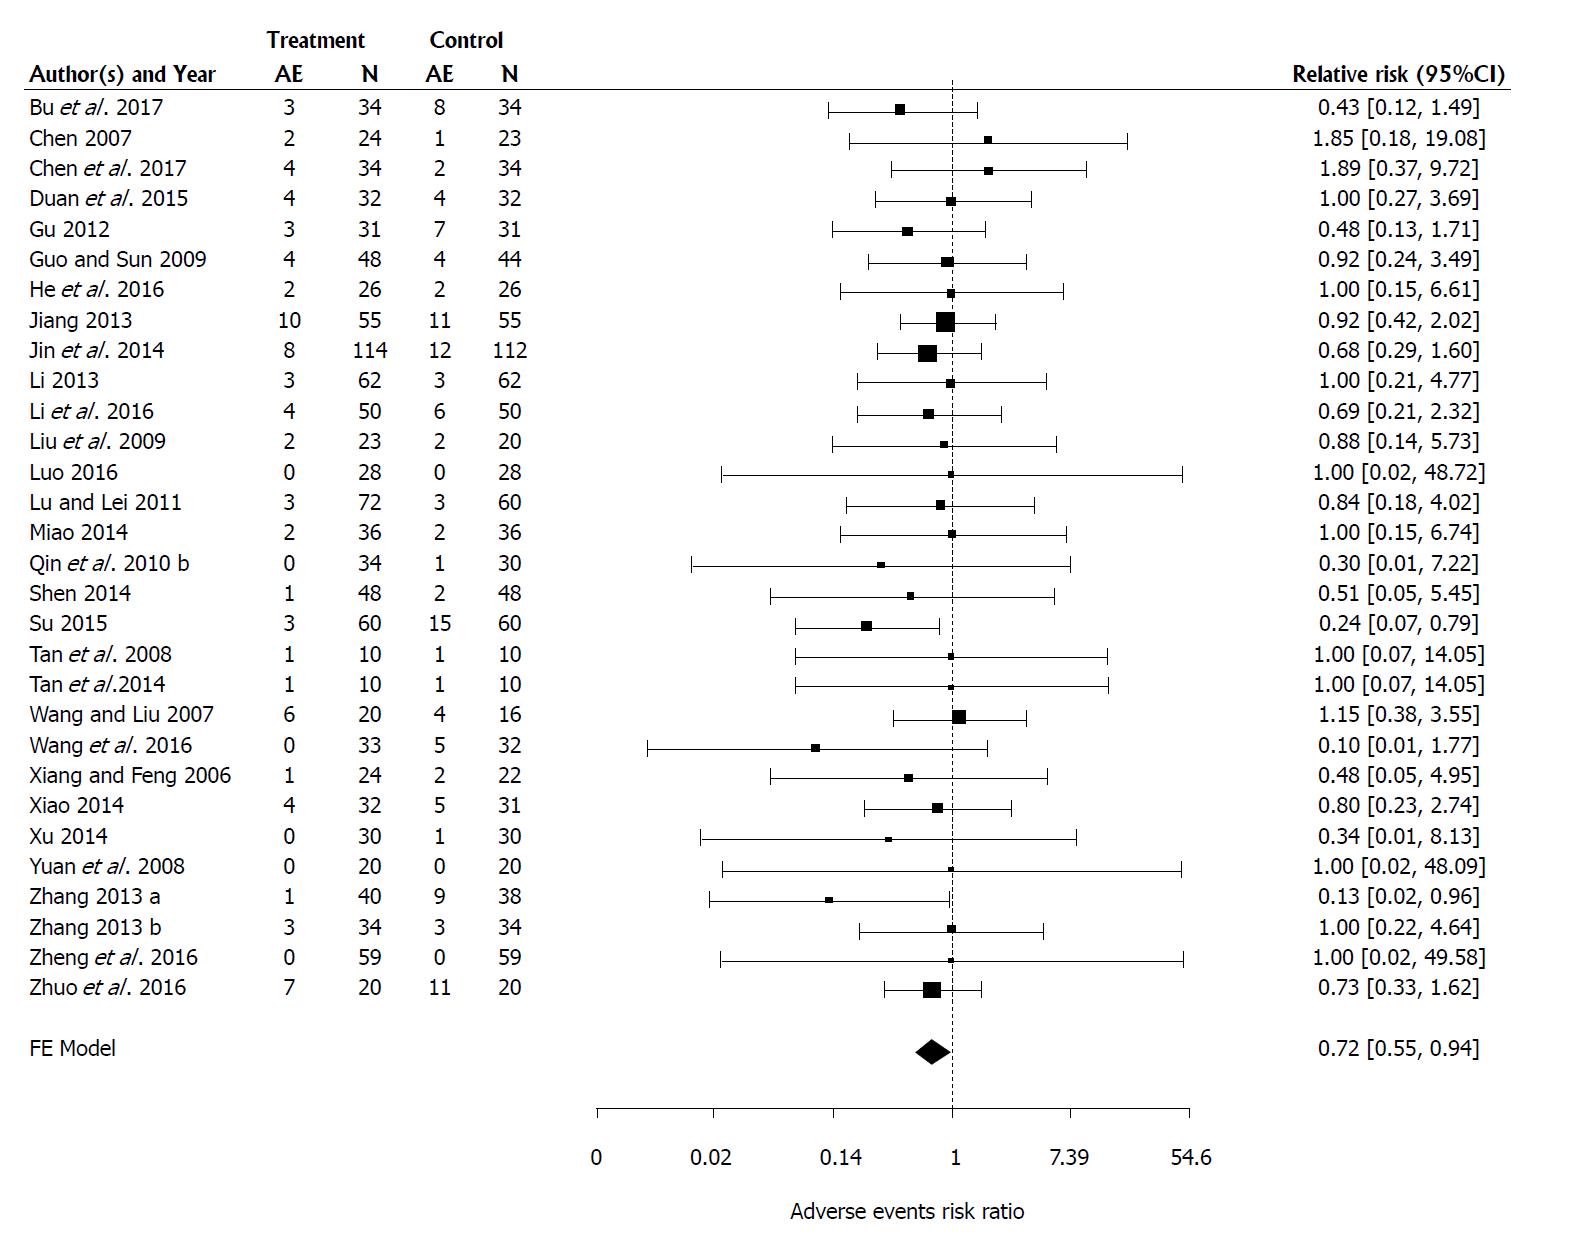
Figure 9 Forest plots of the results of fixed effects meta-analysis with 30 studies evaluating the effect of Medilac-S® in combination with conventional drug therapy on number of participants reporting adverse events.
“AE” is the number of participants reporting adverse events within a study and “N” is the total number of participants within the study. The relative risk (RR) and its 95%CI for each study are listed on the right hand side of the graph. The 95%CI for the estimated mean RR for each concomitant drug therapy category is shown as a shaded diamond with the endpoints of the diamond being the CI endpoints. The vertical dashed line at 1 indicates a RR of 1 which occurs when there is no observed difference between the treatment and the control.
- Citation: Sohail G, Xu X, Christman MC, Tompkins TA. Probiotic Medilac-S® for the induction of clinical remission in a Chinese population with ulcerative colitis: A systematic review and meta-analysis. World J Clin Cases 2018; 6(15): 961-984
- URL: https://www.wjgnet.com/2307-8960/full/v6/i15/961.htm
- DOI: https://dx.doi.org/10.12998/wjcc.v6.i15.961


