Copyright
©The Author(s) 2018.
World J Clin Cases. Dec 6, 2018; 6(15): 961-984
Published online Dec 6, 2018. doi: 10.12998/wjcc.v6.i15.961
Published online Dec 6, 2018. doi: 10.12998/wjcc.v6.i15.961
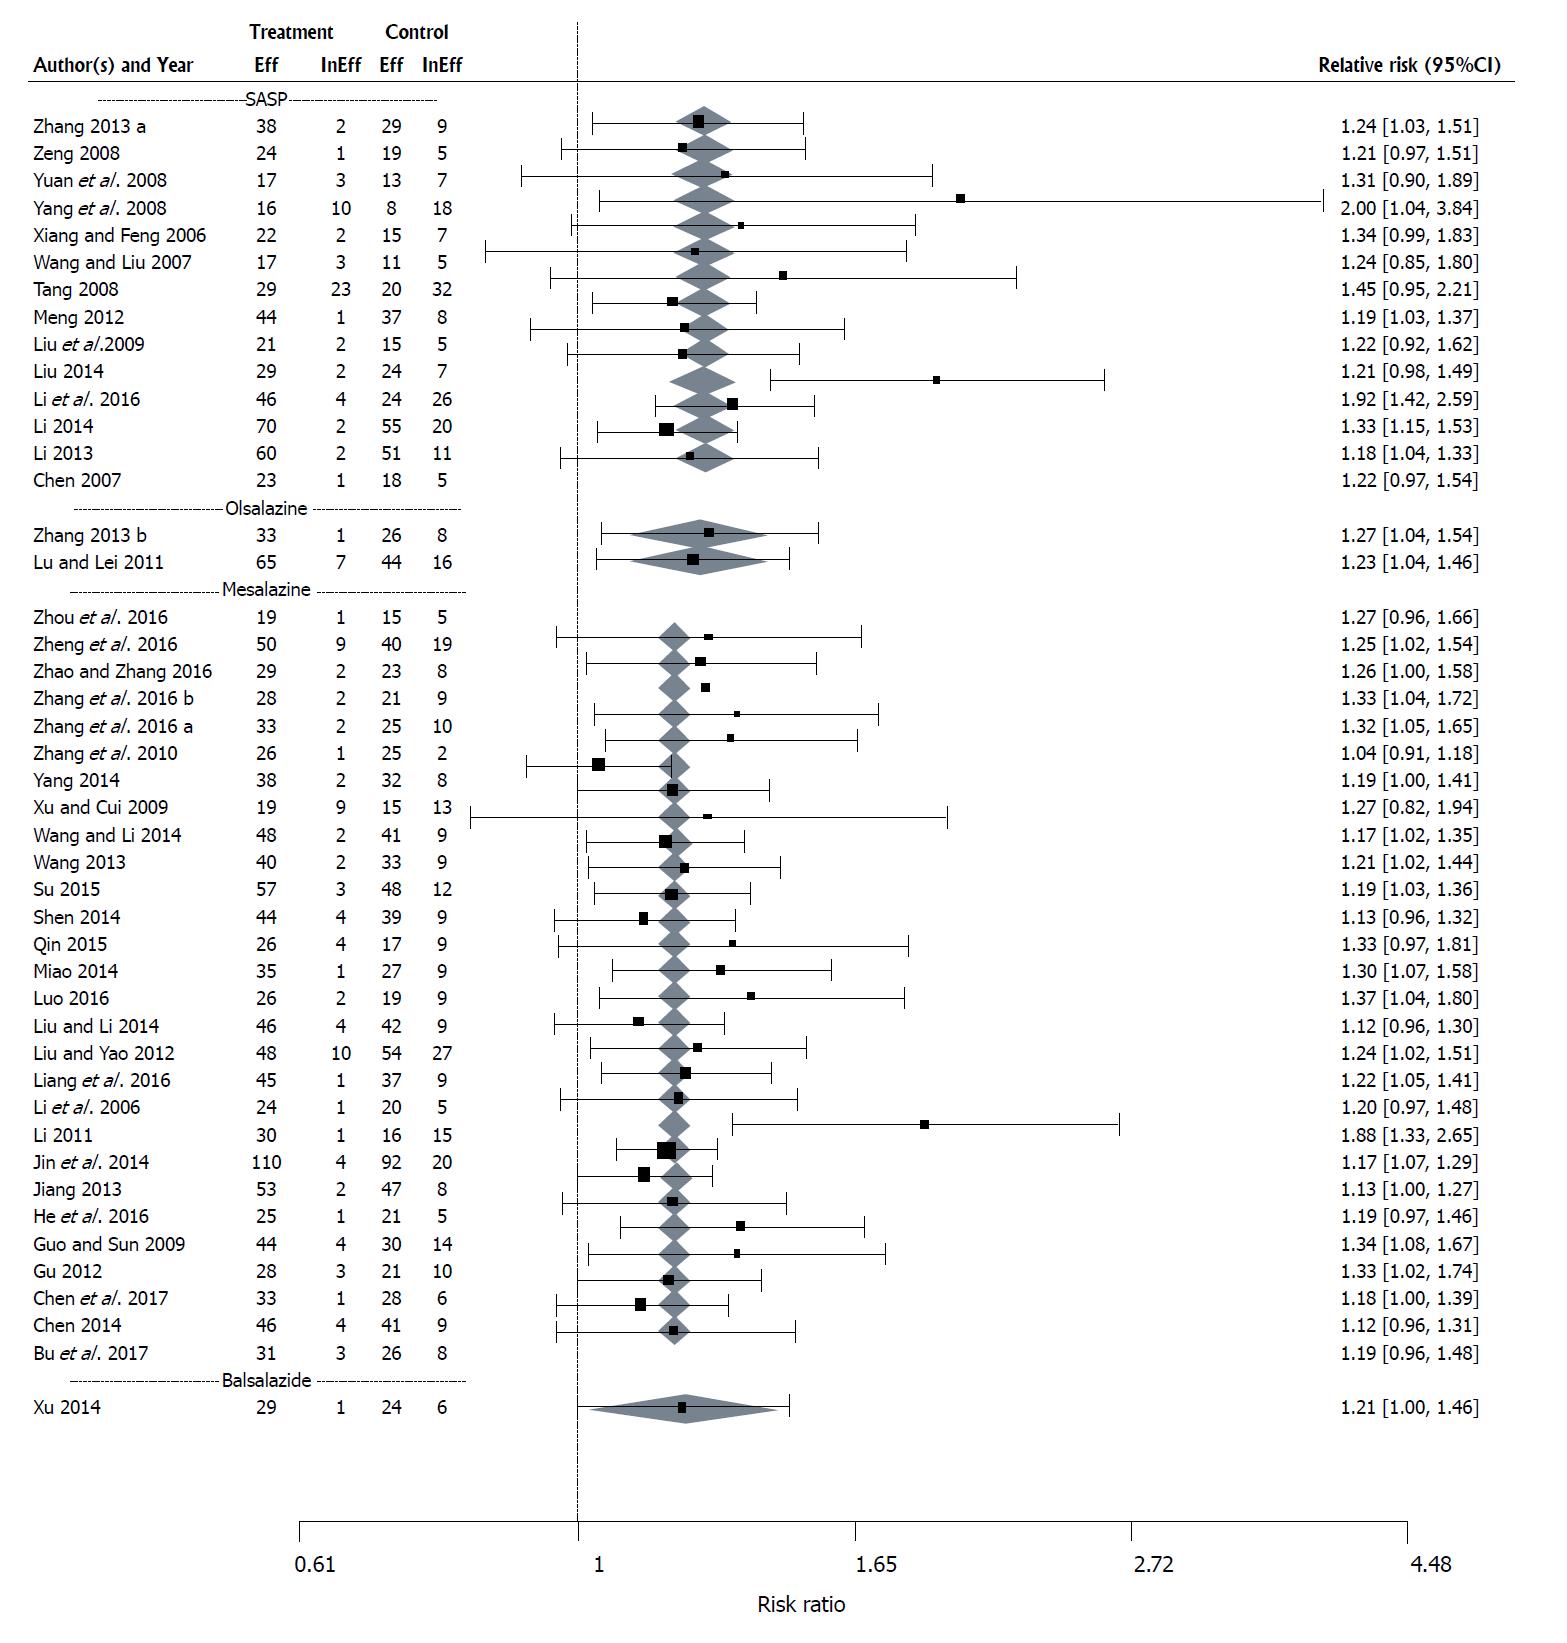
Figure 3 Forest plot of the results of a fixed effects meta-analysis with a moderator for concomitant drug therapy with 45 studies evaluating the effect of Medilac-S® in combination with conventional drug therapy on clinical efficacy.
“Eff” is the number of subjects in the study for which the treatment was effective and “InEff” is the number of subjects in the study for which the treatment was ineffective. The relative risk (RR) and its 95%CI for each study are listed on the right hand side of the graph. The 95%CI for the estimated mean RR for each concomitant drug therapy category is shown as a shaded diamond with the endpoints of the diamond being the CI endpoints and the location of the maximum width of the diamond being at the estimated mean RR for that drug type. The vertical dashed line at 1 indicates a RR of 1 which occurs when there is no observed difference between the treatment and the control.
- Citation: Sohail G, Xu X, Christman MC, Tompkins TA. Probiotic Medilac-S® for the induction of clinical remission in a Chinese population with ulcerative colitis: A systematic review and meta-analysis. World J Clin Cases 2018; 6(15): 961-984
- URL: https://www.wjgnet.com/2307-8960/full/v6/i15/961.htm
- DOI: https://dx.doi.org/10.12998/wjcc.v6.i15.961


