Copyright
©The Author(s) 2018.
World J Clin Cases. Oct 26, 2018; 6(12): 521-530
Published online Oct 26, 2018. doi: 10.12998/wjcc.v6.i12.521
Published online Oct 26, 2018. doi: 10.12998/wjcc.v6.i12.521
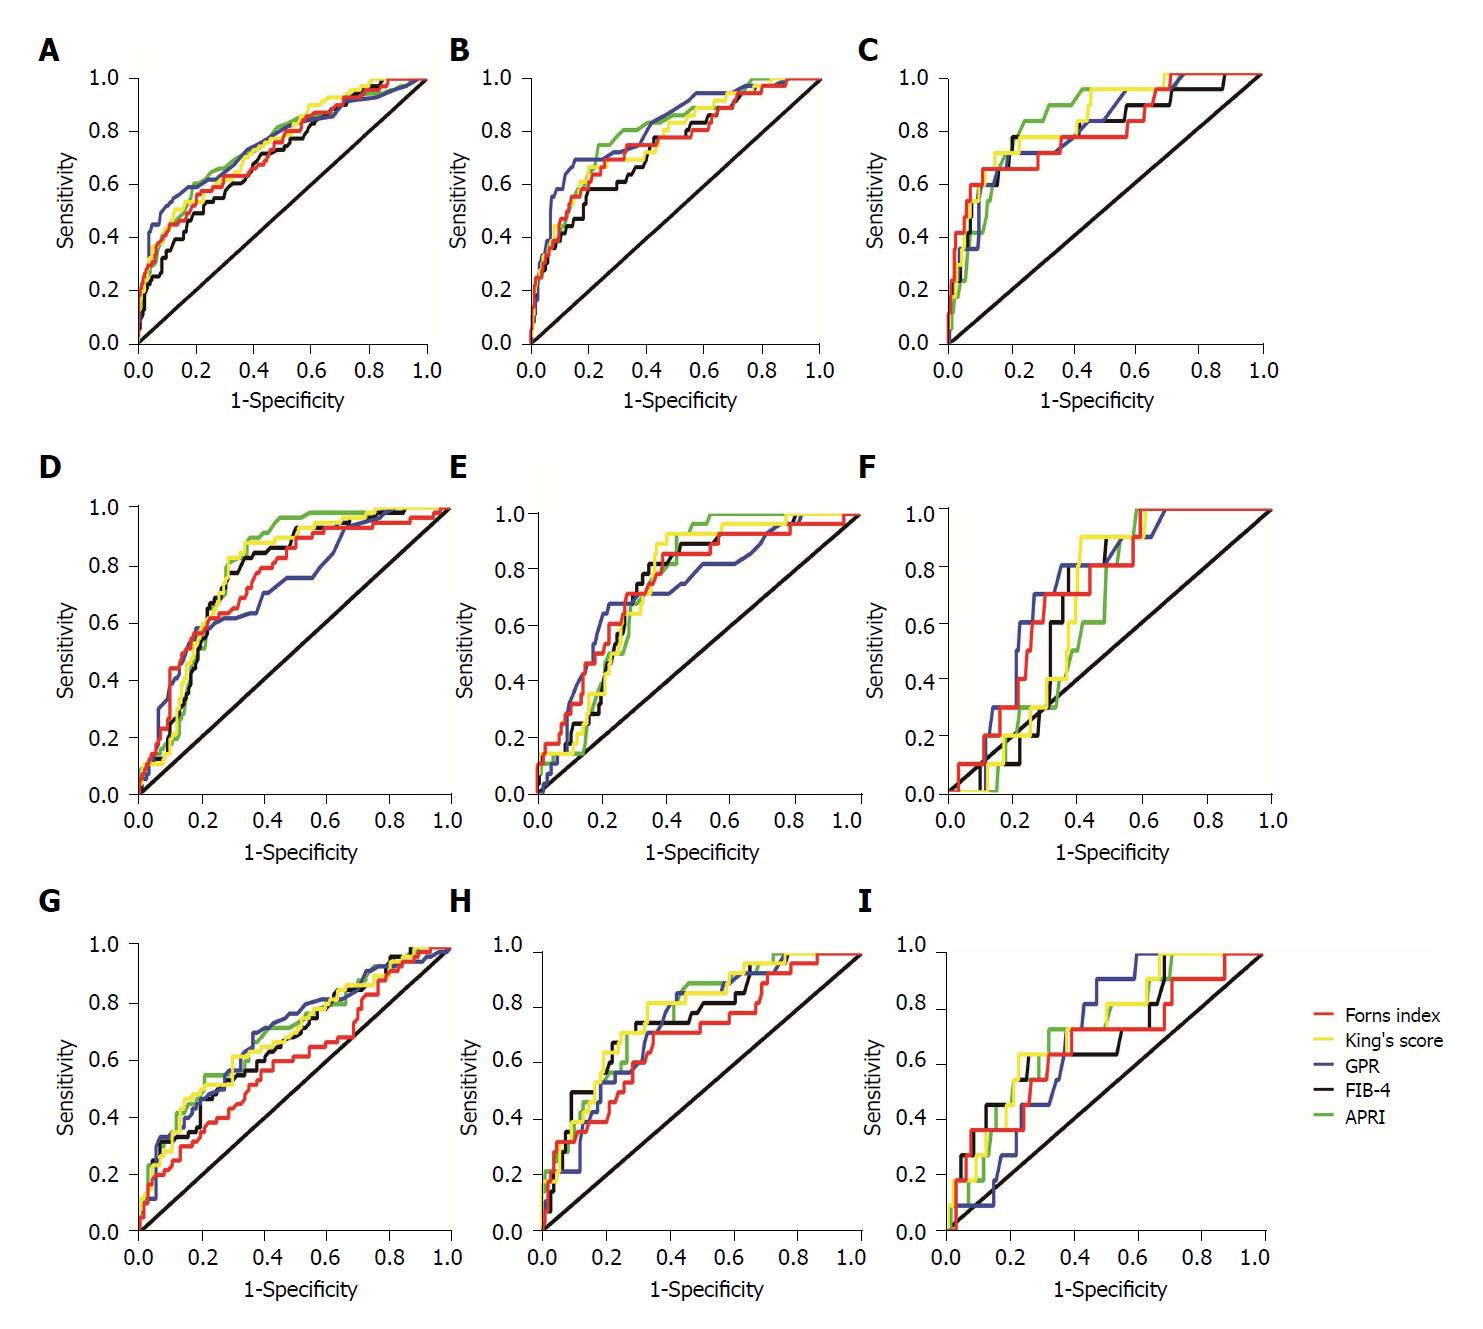
Figure 2 Receiver operating characteristic curve analysis of non-invasive tests for prediction of liver fibrosis stages (S2-4) in the different alanine aminotransferase groups.
A-C: Predicting liver fibrosis in the normal alanine aminotransferase (ALT) group; A: For significant fibrosis (≥ S2); B: For advanced fibrosis (≥S3); C: for cirrhosis (S4); D-F: Predicting liver fibrosis in the slightly elevated ALT group; D: For significant fibrosis (≥ S2); E: For advanced fibrosis (≥ S3); F: For cirrhosis (S4); G-I: Predicting liver fibrosis in the elevated ALT group; G: For significant fibrosis (≥ S2); H: For advanced fibrosis (≥ S3); I: For cirrhosis (S4). GPR: Gamma-glutamyl transpeptidase (GGT)-to-platelet ratio; APRI: Aspartate aminotransferase (AST)-to-platelet (PLT) ratio index; FIB-4: Fibrosis index based on 4 factors.
- Citation: Wang L, Fan YX, Dou XG. Declining diagnostic accuracy of non-invasive fibrosis tests is associated with elevated alanine aminotransferase in chronic hepatitis B. World J Clin Cases 2018; 6(12): 521-530
- URL: https://www.wjgnet.com/2307-8960/full/v6/i12/521.htm
- DOI: https://dx.doi.org/10.12998/wjcc.v6.i12.521


