
















©The Author(s) 2018.
World J Clin Cases. Oct 6, 2018; 6(11): 477-482
Published online Oct 6, 2018. doi: 10.12998/wjcc.v6.i11.477
Published online Oct 6, 2018. doi: 10.12998/wjcc.v6.i11.477
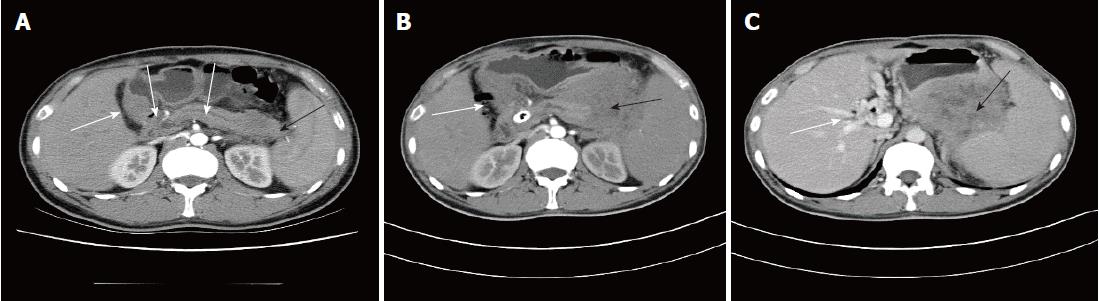
Figure 1 Abdominal computed tomography scan.
A. Axial projection shows the pancreatic duct, intrahepatic, and extrahepatic bile duct dilation (white arrow heads) and low-density pancreatic mass (black arrow head); B. Axial arterial phase projection showing intrahepatic bile duct dilatation and pneumobilia (white arrow head) and pancreatic mass enlargement and enhancement (black arrow head); C. Axial portal phase projection showing portal cavernous transformation (white arrow head) and partial enhancement of the pancreatic mass and areas of low density in the center.
- Citation: Zhu T, Xi XY, Dong HJ. Isolated myeloid sarcoma in the pancreas and orbit: A case report and review of literature. World J Clin Cases 2018; 6(11): 477-482
- URL: https://www.wjgnet.com/2307-8960/full/v6/i11/477.htm
- DOI: https://dx.doi.org/10.12998/wjcc.v6.i11.477