Copyright
©The Author(s) 2016.
World J Clin Cases. Nov 16, 2016; 4(11): 369-374
Published online Nov 16, 2016. doi: 10.12998/wjcc.v4.i11.369
Published online Nov 16, 2016. doi: 10.12998/wjcc.v4.i11.369
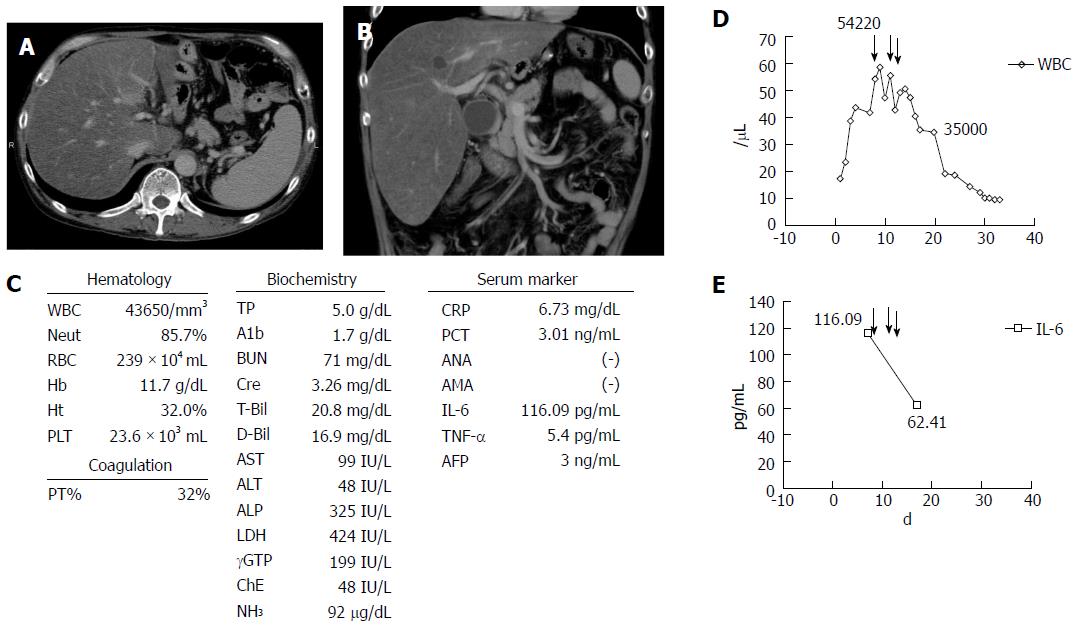
Figure 1 Laboratory data and computed tomography images of cases.
A and B: Computed tomography images (A, axial; B, coronal) of the case upon the admission; C: Summary of the laboratory data upon the admission. Time dependent changes of number of white blood cell (D) and interleukin-6 (E).
- Citation: Watanabe Y, Kamimura K, Iwasaki T, Abe H, Takahashi S, Mizuno KI, Takeuchi M, Eino A, Narita I, Terai S. Case of severe alcoholic hepatitis treated with granulocytapheresis. World J Clin Cases 2016; 4(11): 369-374
- URL: https://www.wjgnet.com/2307-8960/full/v4/i11/369.htm
- DOI: https://dx.doi.org/10.12998/wjcc.v4.i11.369


