Copyright
©The Author(s) 2015.
World J Clin Cases. Sep 16, 2015; 3(9): 853-860
Published online Sep 16, 2015. doi: 10.12998/wjcc.v3.i9.853
Published online Sep 16, 2015. doi: 10.12998/wjcc.v3.i9.853
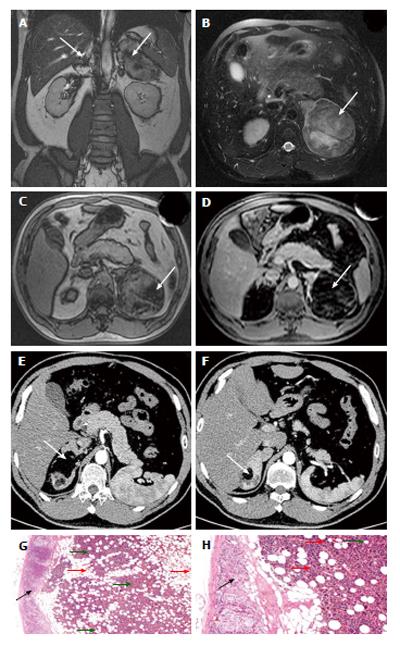
Figure 1 Diagnostic imaging and pathohistological examination results of patient A.
A-D: Magnetic resonance imaging (MRI) results of bilateral adrenal myelolipomas before the first surgical procedure; A and B: 84 mm diameter circular mass (white arrow) with unequal signals on both T1 and T2 weighted MRI scans in the left adrenal gland (short T1 weighted mixed with longer T2). The mass has a clear boundary. An increased T2 signal can be seen within it; C: That an uneven T1 signal (which includes lipid signal) inside the mass reduces on anti-phase gradient echo T1WI in the left adrenal gland (white arrow). A reduced T1 signal intensity is seen on fat-suppressed image; D: There is no contrast enhancement in most part of the mass on dynamic contrast-enhanced MRI (white arrow). Separation of the lower composite signals shows the delayed linear enhancement pattern; E and F: Computed tomography scan results of the patient before the second surgical procedure. A circular mass (white arrow) with clear boundary has mixed low-density signals with the average absorption values of 7-13 Hu in the right adrenal gland. Separation of the lower composite signals shows no contrast enhancement in the mass; G and H: The adrenal myelolipomas observed on H and E stained sections. Tumor-like masses of extramedullary hematopoietic tissue is composed of adipose cells (red arrow) and hematopoietic cells (green arrow). Fat vacuoles can be seen in adipose tissue. Among adipose cells, there are medullary cells, megakaryocytes, erythrocytes and lymphoid cells with different maturity levels among fat cells. Normal adrenal gland tissue (black arrow) is surrounded by adrenal myelolipoma.
- Citation: Yang Y, Ye LY, Yu B, Guo JX, Liu Q, Chen Y. Two case reports of bilateral adrenal myelolipomas. World J Clin Cases 2015; 3(9): 853-860
- URL: https://www.wjgnet.com/2307-8960/full/v3/i9/853.htm
- DOI: https://dx.doi.org/10.12998/wjcc.v3.i9.853


